Dutch vs Immigrants from West Indies Poverty
COMPARE
Dutch
Immigrants from West Indies
Poverty
Poverty Comparison
Dutch
Immigrants from West Indies
11.3%
POVERTY
96.7/ 100
METRIC RATING
78th/ 347
METRIC RANK
14.8%
POVERTY
0.0/ 100
METRIC RATING
275th/ 347
METRIC RANK
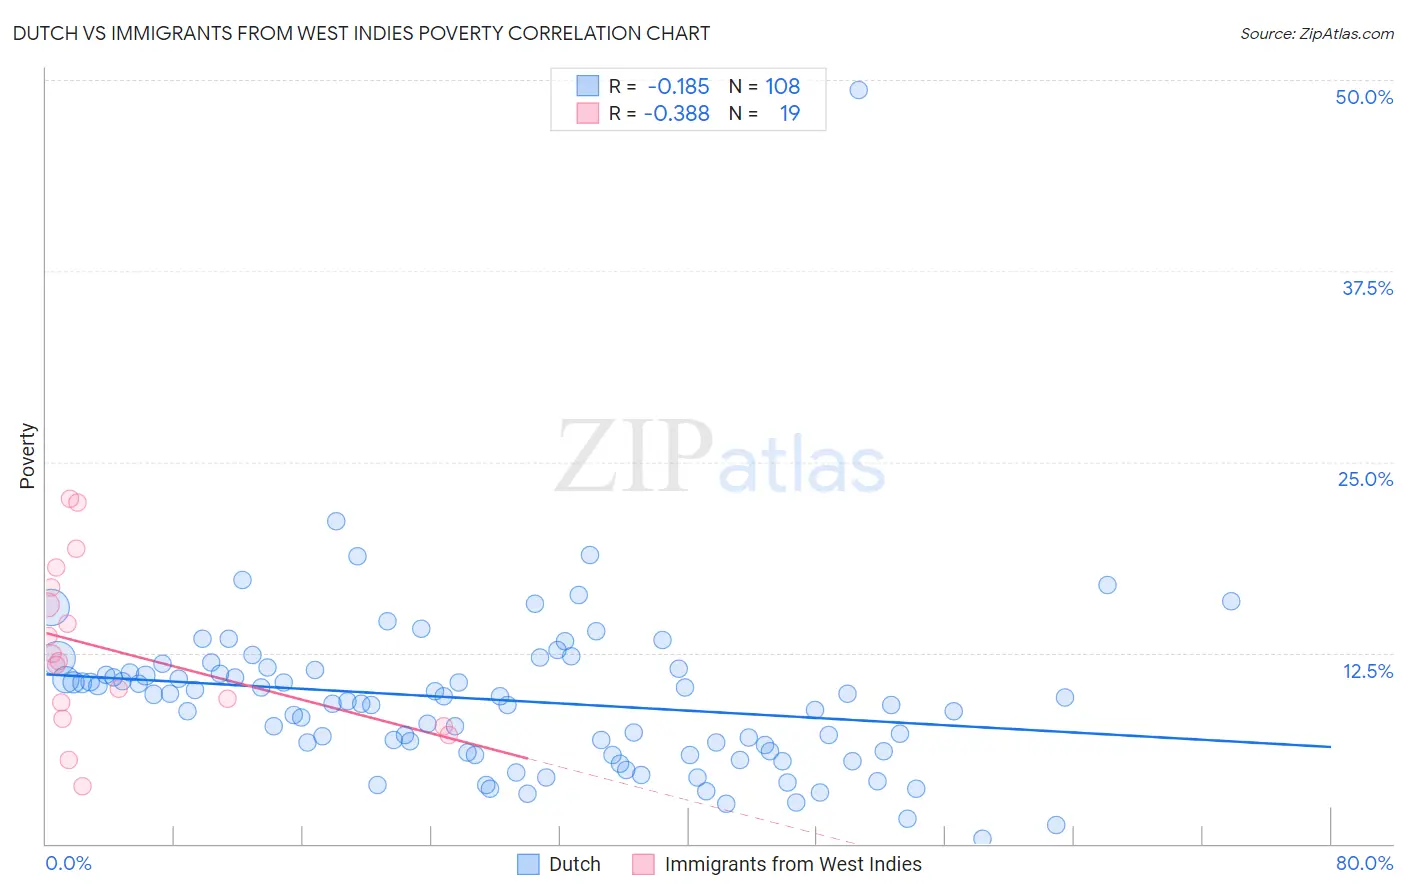
Dutch vs Immigrants from West Indies Poverty Correlation Chart
The statistical analysis conducted on geographies consisting of 553,673,360 people shows a poor negative correlation between the proportion of Dutch and poverty level in the United States with a correlation coefficient (R) of -0.185 and weighted average of 11.3%. Similarly, the statistical analysis conducted on geographies consisting of 72,454,628 people shows a mild negative correlation between the proportion of Immigrants from West Indies and poverty level in the United States with a correlation coefficient (R) of -0.388 and weighted average of 14.8%, a difference of 30.9%.
Poverty Correlation Summary
| Measurement | Dutch | Immigrants from West Indies |
| Minimum | 0.35% | 3.7% |
| Maximum | 49.4% | 22.6% |
| Range | 49.0% | 18.9% |
| Mean | 9.4% | 12.6% |
| Median | 9.3% | 11.9% |
| Interquartile 25% (IQ1) | 6.0% | 8.2% |
| Interquartile 75% (IQ3) | 11.3% | 16.8% |
| Interquartile Range (IQR) | 5.3% | 8.6% |
| Standard Deviation (Sample) | 5.6% | 5.4% |
| Standard Deviation (Population) | 5.6% | 5.3% |
Similar Demographics by Poverty
Demographics Similar to Dutch by Poverty
In terms of poverty, the demographic groups most similar to Dutch are Immigrants from Eastern Asia (11.3%, a difference of 0.010%), Cambodian (11.3%, a difference of 0.040%), Indian (Asian) (11.3%, a difference of 0.060%), Irish (11.3%, a difference of 0.070%), and Immigrants from North America (11.3%, a difference of 0.080%).
| Demographics | Rating | Rank | Poverty |
| Zimbabweans | 97.3 /100 | #71 | Exceptional 11.3% |
| Europeans | 97.2 /100 | #72 | Exceptional 11.3% |
| Immigrants | Belgium | 97.2 /100 | #73 | Exceptional 11.3% |
| Carpatho Rusyns | 97.2 /100 | #74 | Exceptional 11.3% |
| Immigrants | Eastern Europe | 97.0 /100 | #75 | Exceptional 11.3% |
| Immigrants | North America | 96.8 /100 | #76 | Exceptional 11.3% |
| Immigrants | Eastern Asia | 96.7 /100 | #77 | Exceptional 11.3% |
| Dutch | 96.7 /100 | #78 | Exceptional 11.3% |
| Cambodians | 96.7 /100 | #79 | Exceptional 11.3% |
| Indians (Asian) | 96.6 /100 | #80 | Exceptional 11.3% |
| Irish | 96.6 /100 | #81 | Exceptional 11.3% |
| Egyptians | 96.5 /100 | #82 | Exceptional 11.3% |
| Immigrants | Sweden | 96.3 /100 | #83 | Exceptional 11.3% |
| English | 96.3 /100 | #84 | Exceptional 11.3% |
| Immigrants | England | 96.2 /100 | #85 | Exceptional 11.4% |
Demographics Similar to Immigrants from West Indies by Poverty
In terms of poverty, the demographic groups most similar to Immigrants from West Indies are Immigrants from Bahamas (14.8%, a difference of 0.0%), Barbadian (14.8%, a difference of 0.040%), Bangladeshi (14.8%, a difference of 0.060%), Belizean (14.8%, a difference of 0.080%), and Immigrants from St. Vincent and the Grenadines (14.9%, a difference of 0.37%).
| Demographics | Rating | Rank | Poverty |
| Sub-Saharan Africans | 0.1 /100 | #268 | Tragic 14.5% |
| Immigrants | Cuba | 0.1 /100 | #269 | Tragic 14.6% |
| Central Americans | 0.1 /100 | #270 | Tragic 14.6% |
| Shoshone | 0.0 /100 | #271 | Tragic 14.7% |
| Chickasaw | 0.0 /100 | #272 | Tragic 14.7% |
| Spanish Americans | 0.0 /100 | #273 | Tragic 14.7% |
| Barbadians | 0.0 /100 | #274 | Tragic 14.8% |
| Immigrants | West Indies | 0.0 /100 | #275 | Tragic 14.8% |
| Immigrants | Bahamas | 0.0 /100 | #276 | Tragic 14.8% |
| Bangladeshis | 0.0 /100 | #277 | Tragic 14.8% |
| Belizeans | 0.0 /100 | #278 | Tragic 14.8% |
| Immigrants | St. Vincent and the Grenadines | 0.0 /100 | #279 | Tragic 14.9% |
| Haitians | 0.0 /100 | #280 | Tragic 14.9% |
| Immigrants | Barbados | 0.0 /100 | #281 | Tragic 14.9% |
| Comanche | 0.0 /100 | #282 | Tragic 15.0% |