Japanese vs Immigrants from West Indies Poverty
COMPARE
Japanese
Immigrants from West Indies
Poverty
Poverty Comparison
Japanese
Immigrants from West Indies
13.3%
POVERTY
3.3/ 100
METRIC RATING
215th/ 347
METRIC RANK
14.8%
POVERTY
0.0/ 100
METRIC RATING
275th/ 347
METRIC RANK
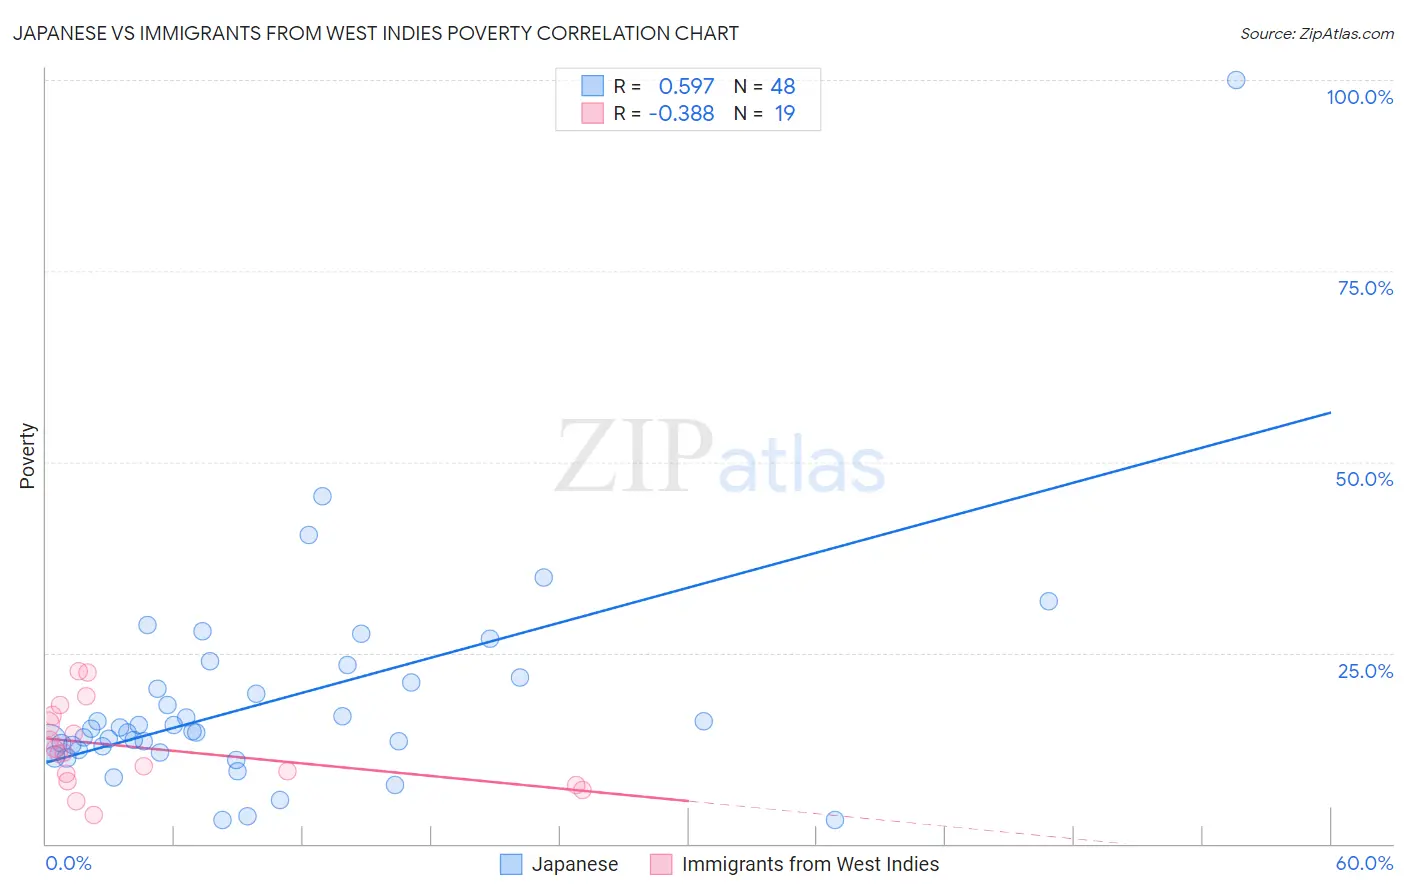
Japanese vs Immigrants from West Indies Poverty Correlation Chart
The statistical analysis conducted on geographies consisting of 249,091,915 people shows a substantial positive correlation between the proportion of Japanese and poverty level in the United States with a correlation coefficient (R) of 0.597 and weighted average of 13.3%. Similarly, the statistical analysis conducted on geographies consisting of 72,454,628 people shows a mild negative correlation between the proportion of Immigrants from West Indies and poverty level in the United States with a correlation coefficient (R) of -0.388 and weighted average of 14.8%, a difference of 11.1%.
Poverty Correlation Summary
| Measurement | Japanese | Immigrants from West Indies |
| Minimum | 3.1% | 3.7% |
| Maximum | 100.0% | 22.6% |
| Range | 96.9% | 18.9% |
| Mean | 18.8% | 12.6% |
| Median | 14.9% | 11.9% |
| Interquartile 25% (IQ1) | 12.5% | 8.2% |
| Interquartile 75% (IQ3) | 21.4% | 16.8% |
| Interquartile Range (IQR) | 8.9% | 8.6% |
| Standard Deviation (Sample) | 14.9% | 5.4% |
| Standard Deviation (Population) | 14.8% | 5.3% |
Similar Demographics by Poverty
Demographics Similar to Japanese by Poverty
In terms of poverty, the demographic groups most similar to Japanese are Nonimmigrants (13.3%, a difference of 0.0%), Immigrants from Uzbekistan (13.3%, a difference of 0.040%), Immigrants from Thailand (13.3%, a difference of 0.10%), Immigrants from Cambodia (13.4%, a difference of 0.23%), and Bermudan (13.3%, a difference of 0.26%).
| Demographics | Rating | Rank | Poverty |
| Ugandans | 6.2 /100 | #208 | Tragic 13.1% |
| Malaysians | 6.1 /100 | #209 | Tragic 13.1% |
| Immigrants | Azores | 6.1 /100 | #210 | Tragic 13.1% |
| Moroccans | 5.2 /100 | #211 | Tragic 13.2% |
| Immigrants | Immigrants | 4.3 /100 | #212 | Tragic 13.2% |
| Immigrants | Panama | 4.1 /100 | #213 | Tragic 13.3% |
| Bermudans | 3.7 /100 | #214 | Tragic 13.3% |
| Japanese | 3.3 /100 | #215 | Tragic 13.3% |
| Immigrants | Nonimmigrants | 3.3 /100 | #216 | Tragic 13.3% |
| Immigrants | Uzbekistan | 3.2 /100 | #217 | Tragic 13.3% |
| Immigrants | Thailand | 3.1 /100 | #218 | Tragic 13.3% |
| Immigrants | Cambodia | 3.0 /100 | #219 | Tragic 13.4% |
| Americans | 2.9 /100 | #220 | Tragic 13.4% |
| Alsatians | 2.6 /100 | #221 | Tragic 13.4% |
| Immigrants | Micronesia | 2.6 /100 | #222 | Tragic 13.4% |
Demographics Similar to Immigrants from West Indies by Poverty
In terms of poverty, the demographic groups most similar to Immigrants from West Indies are Immigrants from Bahamas (14.8%, a difference of 0.0%), Barbadian (14.8%, a difference of 0.040%), Bangladeshi (14.8%, a difference of 0.060%), Belizean (14.8%, a difference of 0.080%), and Immigrants from St. Vincent and the Grenadines (14.9%, a difference of 0.37%).
| Demographics | Rating | Rank | Poverty |
| Sub-Saharan Africans | 0.1 /100 | #268 | Tragic 14.5% |
| Immigrants | Cuba | 0.1 /100 | #269 | Tragic 14.6% |
| Central Americans | 0.1 /100 | #270 | Tragic 14.6% |
| Shoshone | 0.0 /100 | #271 | Tragic 14.7% |
| Chickasaw | 0.0 /100 | #272 | Tragic 14.7% |
| Spanish Americans | 0.0 /100 | #273 | Tragic 14.7% |
| Barbadians | 0.0 /100 | #274 | Tragic 14.8% |
| Immigrants | West Indies | 0.0 /100 | #275 | Tragic 14.8% |
| Immigrants | Bahamas | 0.0 /100 | #276 | Tragic 14.8% |
| Bangladeshis | 0.0 /100 | #277 | Tragic 14.8% |
| Belizeans | 0.0 /100 | #278 | Tragic 14.8% |
| Immigrants | St. Vincent and the Grenadines | 0.0 /100 | #279 | Tragic 14.9% |
| Haitians | 0.0 /100 | #280 | Tragic 14.9% |
| Immigrants | Barbados | 0.0 /100 | #281 | Tragic 14.9% |
| Comanche | 0.0 /100 | #282 | Tragic 15.0% |