Immigrants from Nigeria vs Immigrants from West Indies Poverty
COMPARE
Immigrants from Nigeria
Immigrants from West Indies
Poverty
Poverty Comparison
Immigrants from Nigeria
Immigrants from West Indies
13.5%
POVERTY
1.7/ 100
METRIC RATING
228th/ 347
METRIC RANK
14.8%
POVERTY
0.0/ 100
METRIC RATING
275th/ 347
METRIC RANK
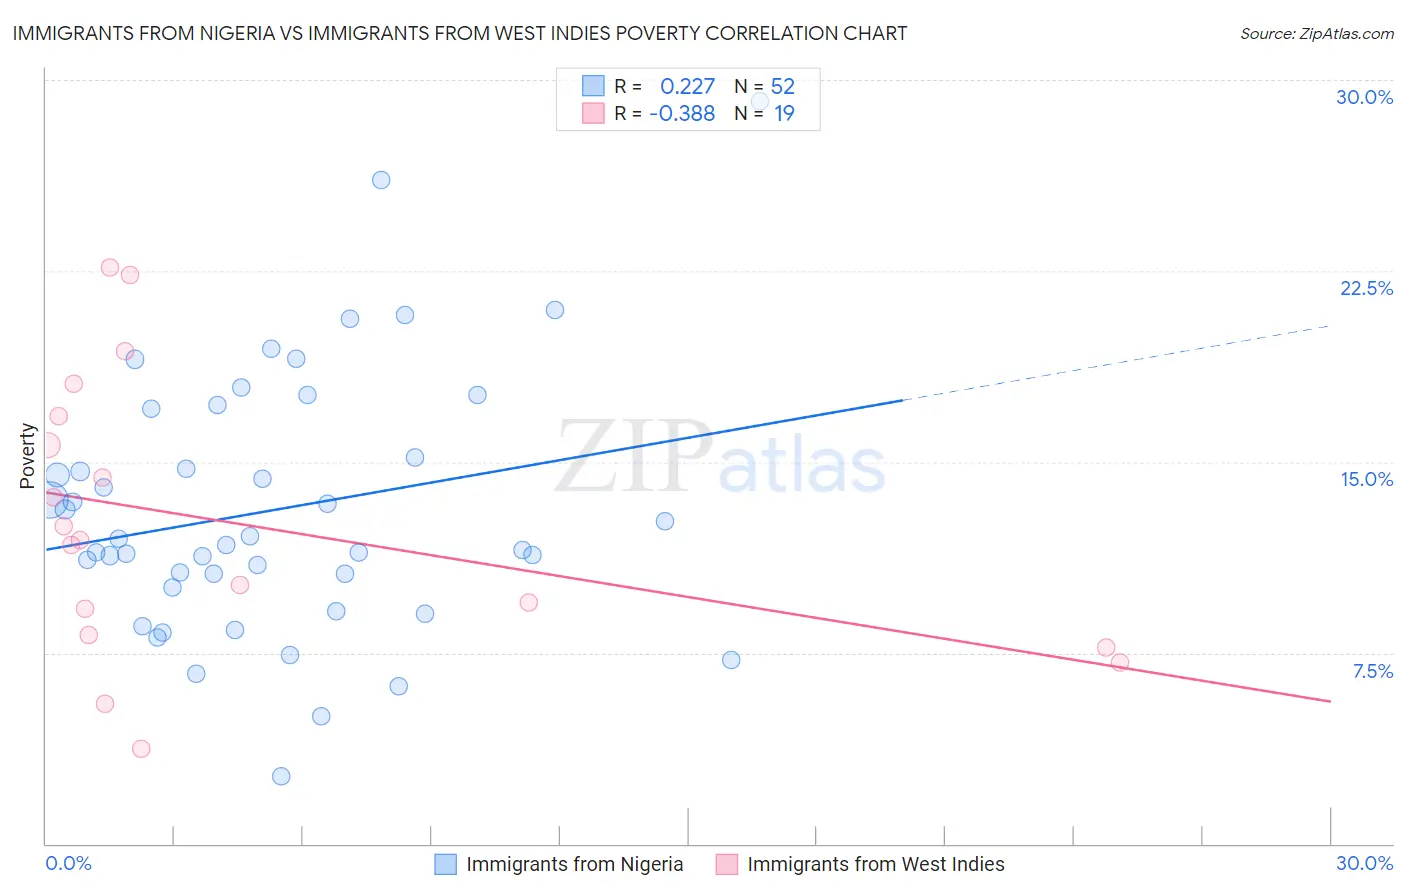
Immigrants from Nigeria vs Immigrants from West Indies Poverty Correlation Chart
The statistical analysis conducted on geographies consisting of 283,297,538 people shows a weak positive correlation between the proportion of Immigrants from Nigeria and poverty level in the United States with a correlation coefficient (R) of 0.227 and weighted average of 13.5%. Similarly, the statistical analysis conducted on geographies consisting of 72,454,628 people shows a mild negative correlation between the proportion of Immigrants from West Indies and poverty level in the United States with a correlation coefficient (R) of -0.388 and weighted average of 14.8%, a difference of 9.5%.
Poverty Correlation Summary
| Measurement | Immigrants from Nigeria | Immigrants from West Indies |
| Minimum | 2.6% | 3.7% |
| Maximum | 29.2% | 22.6% |
| Range | 26.5% | 18.9% |
| Mean | 13.1% | 12.6% |
| Median | 11.9% | 11.9% |
| Interquartile 25% (IQ1) | 10.3% | 8.2% |
| Interquartile 75% (IQ3) | 16.1% | 16.8% |
| Interquartile Range (IQR) | 5.8% | 8.6% |
| Standard Deviation (Sample) | 5.1% | 5.4% |
| Standard Deviation (Population) | 5.1% | 5.3% |
Similar Demographics by Poverty
Demographics Similar to Immigrants from Nigeria by Poverty
In terms of poverty, the demographic groups most similar to Immigrants from Nigeria are Osage (13.6%, a difference of 0.24%), Alaskan Athabascan (13.6%, a difference of 0.30%), Alaska Native (13.5%, a difference of 0.45%), Nigerian (13.6%, a difference of 0.46%), and Marshallese (13.4%, a difference of 0.60%).
| Demographics | Rating | Rank | Poverty |
| Alsatians | 2.6 /100 | #221 | Tragic 13.4% |
| Immigrants | Micronesia | 2.6 /100 | #222 | Tragic 13.4% |
| Immigrants | Africa | 2.5 /100 | #223 | Tragic 13.4% |
| Immigrants | Eritrea | 2.4 /100 | #224 | Tragic 13.4% |
| German Russians | 2.2 /100 | #225 | Tragic 13.4% |
| Marshallese | 2.2 /100 | #226 | Tragic 13.4% |
| Alaska Natives | 2.1 /100 | #227 | Tragic 13.5% |
| Immigrants | Nigeria | 1.7 /100 | #228 | Tragic 13.5% |
| Osage | 1.5 /100 | #229 | Tragic 13.6% |
| Alaskan Athabascans | 1.5 /100 | #230 | Tragic 13.6% |
| Nigerians | 1.4 /100 | #231 | Tragic 13.6% |
| Fijians | 0.8 /100 | #232 | Tragic 13.7% |
| Immigrants | Saudi Arabia | 0.8 /100 | #233 | Tragic 13.8% |
| Immigrants | Laos | 0.7 /100 | #234 | Tragic 13.8% |
| Cubans | 0.6 /100 | #235 | Tragic 13.9% |
Demographics Similar to Immigrants from West Indies by Poverty
In terms of poverty, the demographic groups most similar to Immigrants from West Indies are Immigrants from Bahamas (14.8%, a difference of 0.0%), Barbadian (14.8%, a difference of 0.040%), Bangladeshi (14.8%, a difference of 0.060%), Belizean (14.8%, a difference of 0.080%), and Immigrants from St. Vincent and the Grenadines (14.9%, a difference of 0.37%).
| Demographics | Rating | Rank | Poverty |
| Sub-Saharan Africans | 0.1 /100 | #268 | Tragic 14.5% |
| Immigrants | Cuba | 0.1 /100 | #269 | Tragic 14.6% |
| Central Americans | 0.1 /100 | #270 | Tragic 14.6% |
| Shoshone | 0.0 /100 | #271 | Tragic 14.7% |
| Chickasaw | 0.0 /100 | #272 | Tragic 14.7% |
| Spanish Americans | 0.0 /100 | #273 | Tragic 14.7% |
| Barbadians | 0.0 /100 | #274 | Tragic 14.8% |
| Immigrants | West Indies | 0.0 /100 | #275 | Tragic 14.8% |
| Immigrants | Bahamas | 0.0 /100 | #276 | Tragic 14.8% |
| Bangladeshis | 0.0 /100 | #277 | Tragic 14.8% |
| Belizeans | 0.0 /100 | #278 | Tragic 14.8% |
| Immigrants | St. Vincent and the Grenadines | 0.0 /100 | #279 | Tragic 14.9% |
| Haitians | 0.0 /100 | #280 | Tragic 14.9% |
| Immigrants | Barbados | 0.0 /100 | #281 | Tragic 14.9% |
| Comanche | 0.0 /100 | #282 | Tragic 15.0% |