Moroccan vs Ute Family Poverty
COMPARE
Moroccan
Ute
Family Poverty
Family Poverty Comparison
Moroccans
Ute
9.8%
FAMILY POVERTY
6.5/ 100
METRIC RATING
216th/ 347
METRIC RANK
12.1%
FAMILY POVERTY
0.0/ 100
METRIC RATING
311th/ 347
METRIC RANK
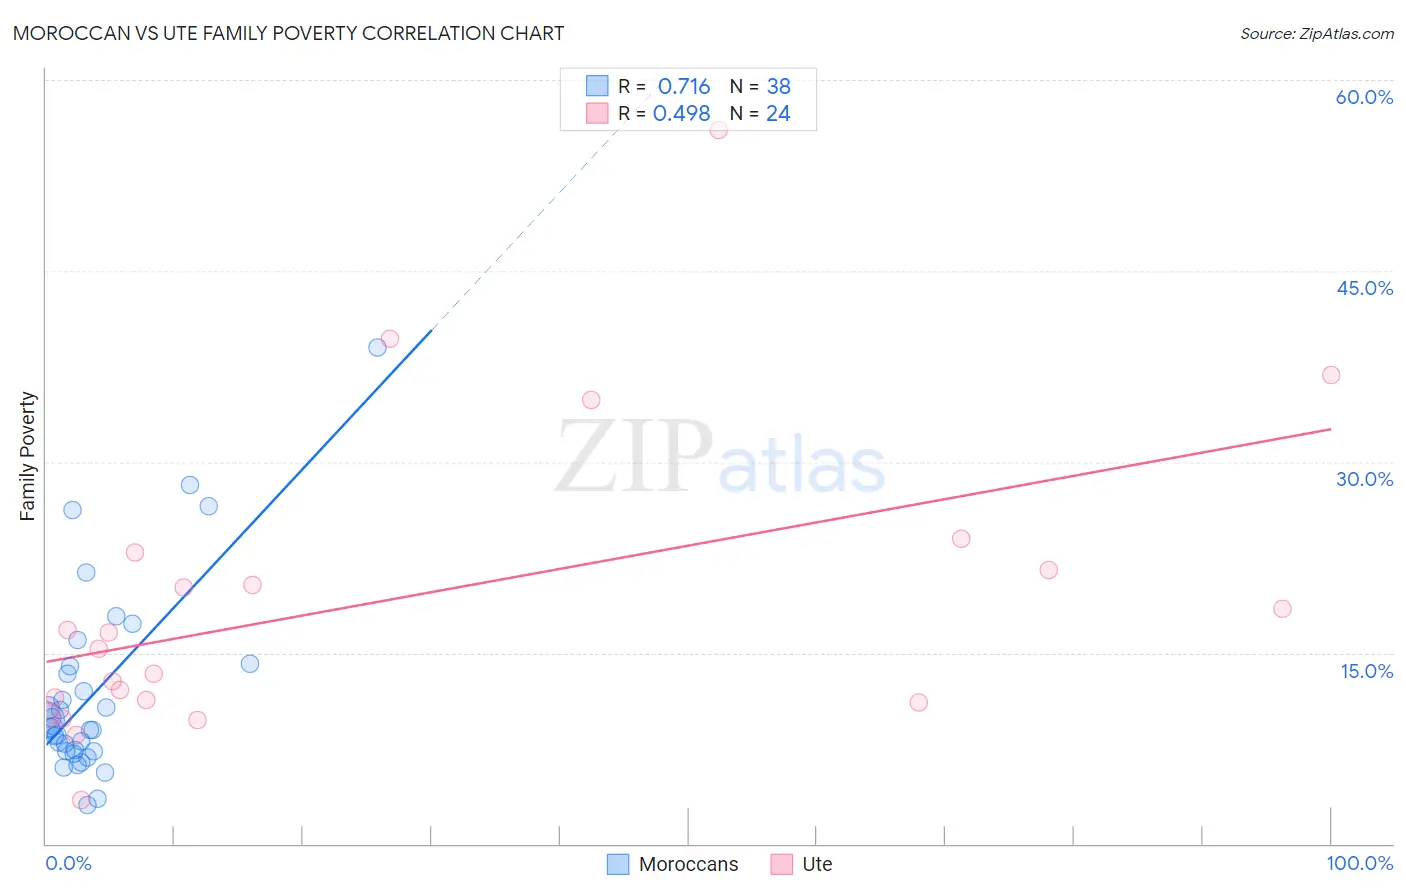
Moroccan vs Ute Family Poverty Correlation Chart
The statistical analysis conducted on geographies consisting of 201,527,529 people shows a strong positive correlation between the proportion of Moroccans and poverty level among families in the United States with a correlation coefficient (R) of 0.716 and weighted average of 9.8%. Similarly, the statistical analysis conducted on geographies consisting of 55,645,170 people shows a moderate positive correlation between the proportion of Ute and poverty level among families in the United States with a correlation coefficient (R) of 0.498 and weighted average of 12.1%, a difference of 23.2%.
Family Poverty Correlation Summary
| Measurement | Moroccan | Ute |
| Minimum | 3.0% | 3.5% |
| Maximum | 39.0% | 56.1% |
| Range | 36.0% | 52.6% |
| Mean | 11.9% | 19.0% |
| Median | 9.2% | 15.9% |
| Interquartile 25% (IQ1) | 7.2% | 11.2% |
| Interquartile 75% (IQ3) | 14.0% | 22.2% |
| Interquartile Range (IQR) | 6.7% | 11.0% |
| Standard Deviation (Sample) | 7.6% | 12.1% |
| Standard Deviation (Population) | 7.5% | 11.8% |
Similar Demographics by Family Poverty
Demographics Similar to Moroccans by Family Poverty
In terms of family poverty, the demographic groups most similar to Moroccans are Nonimmigrants (9.8%, a difference of 0.060%), Immigrants from Micronesia (9.8%, a difference of 0.090%), American (9.8%, a difference of 0.20%), Panamanian (9.8%, a difference of 0.52%), and Immigrants from Eritrea (9.9%, a difference of 0.64%).
| Demographics | Rating | Rank | Family Poverty |
| Immigrants | Uruguay | 14.0 /100 | #209 | Poor 9.5% |
| Alsatians | 11.3 /100 | #210 | Poor 9.6% |
| Malaysians | 10.6 /100 | #211 | Poor 9.6% |
| Immigrants | Thailand | 9.7 /100 | #212 | Tragic 9.7% |
| Osage | 8.0 /100 | #213 | Tragic 9.7% |
| Immigrants | Micronesia | 6.7 /100 | #214 | Tragic 9.8% |
| Immigrants | Nonimmigrants | 6.7 /100 | #215 | Tragic 9.8% |
| Moroccans | 6.5 /100 | #216 | Tragic 9.8% |
| Americans | 6.2 /100 | #217 | Tragic 9.8% |
| Panamanians | 5.6 /100 | #218 | Tragic 9.8% |
| Immigrants | Eritrea | 5.4 /100 | #219 | Tragic 9.9% |
| Bermudans | 5.3 /100 | #220 | Tragic 9.9% |
| Immigrants | Cambodia | 4.8 /100 | #221 | Tragic 9.9% |
| Japanese | 4.8 /100 | #222 | Tragic 9.9% |
| Immigrants | Africa | 4.3 /100 | #223 | Tragic 9.9% |
Demographics Similar to Ute by Family Poverty
In terms of family poverty, the demographic groups most similar to Ute are Immigrants from Central America (12.1%, a difference of 0.38%), Hispanic or Latino (12.0%, a difference of 0.84%), Immigrants from Guatemala (12.0%, a difference of 0.84%), Immigrants from Caribbean (12.2%, a difference of 1.1%), and Seminole (11.9%, a difference of 1.3%).
| Demographics | Rating | Rank | Family Poverty |
| Immigrants | Latin America | 0.0 /100 | #304 | Tragic 11.8% |
| Mexicans | 0.0 /100 | #305 | Tragic 11.8% |
| Cajuns | 0.0 /100 | #306 | Tragic 11.9% |
| Immigrants | Congo | 0.0 /100 | #307 | Tragic 11.9% |
| Seminole | 0.0 /100 | #308 | Tragic 11.9% |
| Hispanics or Latinos | 0.0 /100 | #309 | Tragic 12.0% |
| Immigrants | Guatemala | 0.0 /100 | #310 | Tragic 12.0% |
| Ute | 0.0 /100 | #311 | Tragic 12.1% |
| Immigrants | Central America | 0.0 /100 | #312 | Tragic 12.1% |
| Immigrants | Caribbean | 0.0 /100 | #313 | Tragic 12.2% |
| Kiowa | 0.0 /100 | #314 | Tragic 12.2% |
| Immigrants | Mexico | 0.0 /100 | #315 | Tragic 12.3% |
| Hondurans | 0.0 /100 | #316 | Tragic 12.4% |
| Immigrants | Grenada | 0.0 /100 | #317 | Tragic 12.4% |
| U.S. Virgin Islanders | 0.0 /100 | #318 | Tragic 12.4% |