Mongolian vs Icelander Single Female Poverty
COMPARE
Mongolian
Icelander
Single Female Poverty
Single Female Poverty Comparison
Mongolians
Icelanders
20.2%
SINGLE FEMALE POVERTY
93.2/ 100
METRIC RATING
127th/ 347
METRIC RANK
21.6%
SINGLE FEMALE POVERTY
14.0/ 100
METRIC RATING
211th/ 347
METRIC RANK
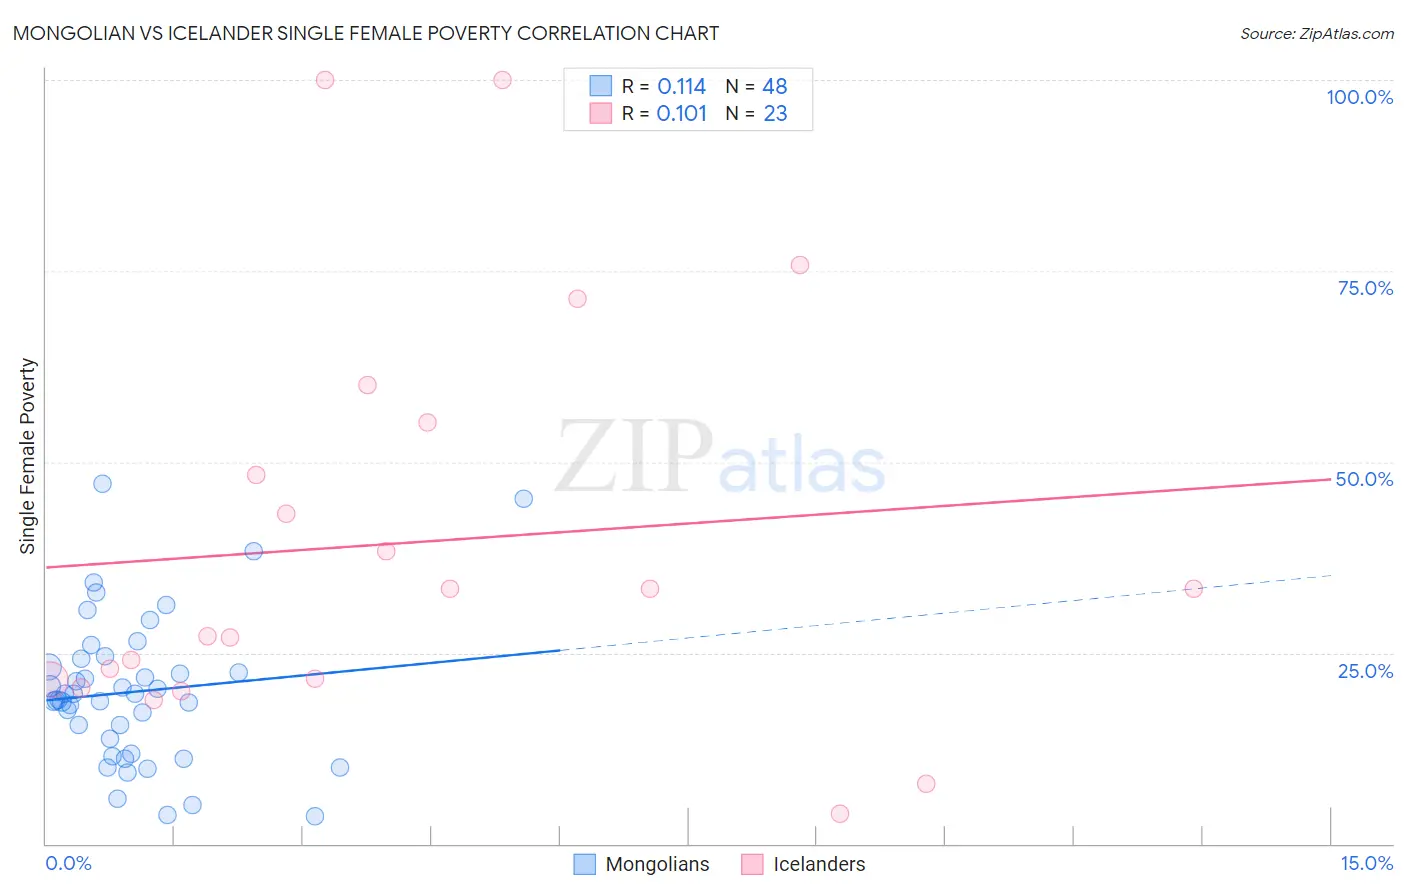
Mongolian vs Icelander Single Female Poverty Correlation Chart
The statistical analysis conducted on geographies consisting of 139,671,707 people shows a poor positive correlation between the proportion of Mongolians and poverty level among single females in the United States with a correlation coefficient (R) of 0.114 and weighted average of 20.2%. Similarly, the statistical analysis conducted on geographies consisting of 158,245,143 people shows a poor positive correlation between the proportion of Icelanders and poverty level among single females in the United States with a correlation coefficient (R) of 0.101 and weighted average of 21.6%, a difference of 7.2%.
Single Female Poverty Correlation Summary
| Measurement | Mongolian | Icelander |
| Minimum | 3.5% | 3.9% |
| Maximum | 47.1% | 100.0% |
| Range | 43.6% | 96.1% |
| Mean | 19.9% | 39.4% |
| Median | 19.2% | 33.3% |
| Interquartile 25% (IQ1) | 12.8% | 21.4% |
| Interquartile 75% (IQ3) | 23.7% | 55.2% |
| Interquartile Range (IQR) | 10.9% | 33.8% |
| Standard Deviation (Sample) | 9.6% | 26.5% |
| Standard Deviation (Population) | 9.5% | 25.9% |
Similar Demographics by Single Female Poverty
Demographics Similar to Mongolians by Single Female Poverty
In terms of single female poverty, the demographic groups most similar to Mongolians are Serbian (20.1%, a difference of 0.020%), Immigrants from Spain (20.2%, a difference of 0.11%), Immigrants from South Africa (20.1%, a difference of 0.19%), Immigrants from Morocco (20.2%, a difference of 0.19%), and Immigrants from Hungary (20.2%, a difference of 0.21%).
| Demographics | Rating | Rank | Single Female Poverty |
| South Americans | 95.1 /100 | #120 | Exceptional 20.0% |
| Immigrants | Switzerland | 95.1 /100 | #121 | Exceptional 20.0% |
| Immigrants | South America | 95.0 /100 | #122 | Exceptional 20.0% |
| Brazilians | 94.4 /100 | #123 | Exceptional 20.1% |
| Immigrants | Chile | 94.3 /100 | #124 | Exceptional 20.1% |
| Immigrants | South Africa | 93.9 /100 | #125 | Exceptional 20.1% |
| Serbians | 93.3 /100 | #126 | Exceptional 20.1% |
| Mongolians | 93.2 /100 | #127 | Exceptional 20.2% |
| Immigrants | Spain | 92.7 /100 | #128 | Exceptional 20.2% |
| Immigrants | Morocco | 92.4 /100 | #129 | Exceptional 20.2% |
| Immigrants | Hungary | 92.3 /100 | #130 | Exceptional 20.2% |
| Pakistanis | 92.1 /100 | #131 | Exceptional 20.2% |
| Uruguayans | 92.1 /100 | #132 | Exceptional 20.2% |
| Immigrants | England | 91.9 /100 | #133 | Exceptional 20.2% |
| Immigrants | Venezuela | 91.5 /100 | #134 | Exceptional 20.2% |
Demographics Similar to Icelanders by Single Female Poverty
In terms of single female poverty, the demographic groups most similar to Icelanders are Jamaican (21.6%, a difference of 0.010%), Immigrants from Panama (21.6%, a difference of 0.040%), Guamanian/Chamorro (21.6%, a difference of 0.040%), Immigrants from Nicaragua (21.6%, a difference of 0.10%), and Immigrants from Eastern Africa (21.6%, a difference of 0.13%).
| Demographics | Rating | Rank | Single Female Poverty |
| Immigrants | Africa | 16.7 /100 | #204 | Poor 21.5% |
| Finns | 16.2 /100 | #205 | Poor 21.5% |
| Belgians | 16.1 /100 | #206 | Poor 21.5% |
| Ghanaians | 15.7 /100 | #207 | Poor 21.6% |
| Haitians | 15.4 /100 | #208 | Poor 21.6% |
| Immigrants | Eastern Africa | 15.1 /100 | #209 | Poor 21.6% |
| Immigrants | Panama | 14.4 /100 | #210 | Poor 21.6% |
| Icelanders | 14.0 /100 | #211 | Poor 21.6% |
| Jamaicans | 14.0 /100 | #212 | Poor 21.6% |
| Guamanians/Chamorros | 13.7 /100 | #213 | Poor 21.6% |
| Immigrants | Nicaragua | 13.3 /100 | #214 | Poor 21.6% |
| Ecuadorians | 12.3 /100 | #215 | Poor 21.6% |
| Immigrants | Barbados | 12.2 /100 | #216 | Poor 21.7% |
| Immigrants | St. Vincent and the Grenadines | 11.7 /100 | #217 | Poor 21.7% |
| Nepalese | 9.7 /100 | #218 | Tragic 21.7% |