German Russian vs Icelander Single Female Poverty
COMPARE
German Russian
Icelander
Single Female Poverty
Single Female Poverty Comparison
German Russians
Icelanders
23.9%
SINGLE FEMALE POVERTY
0.0/ 100
METRIC RATING
283rd/ 347
METRIC RANK
21.6%
SINGLE FEMALE POVERTY
14.0/ 100
METRIC RATING
211th/ 347
METRIC RANK
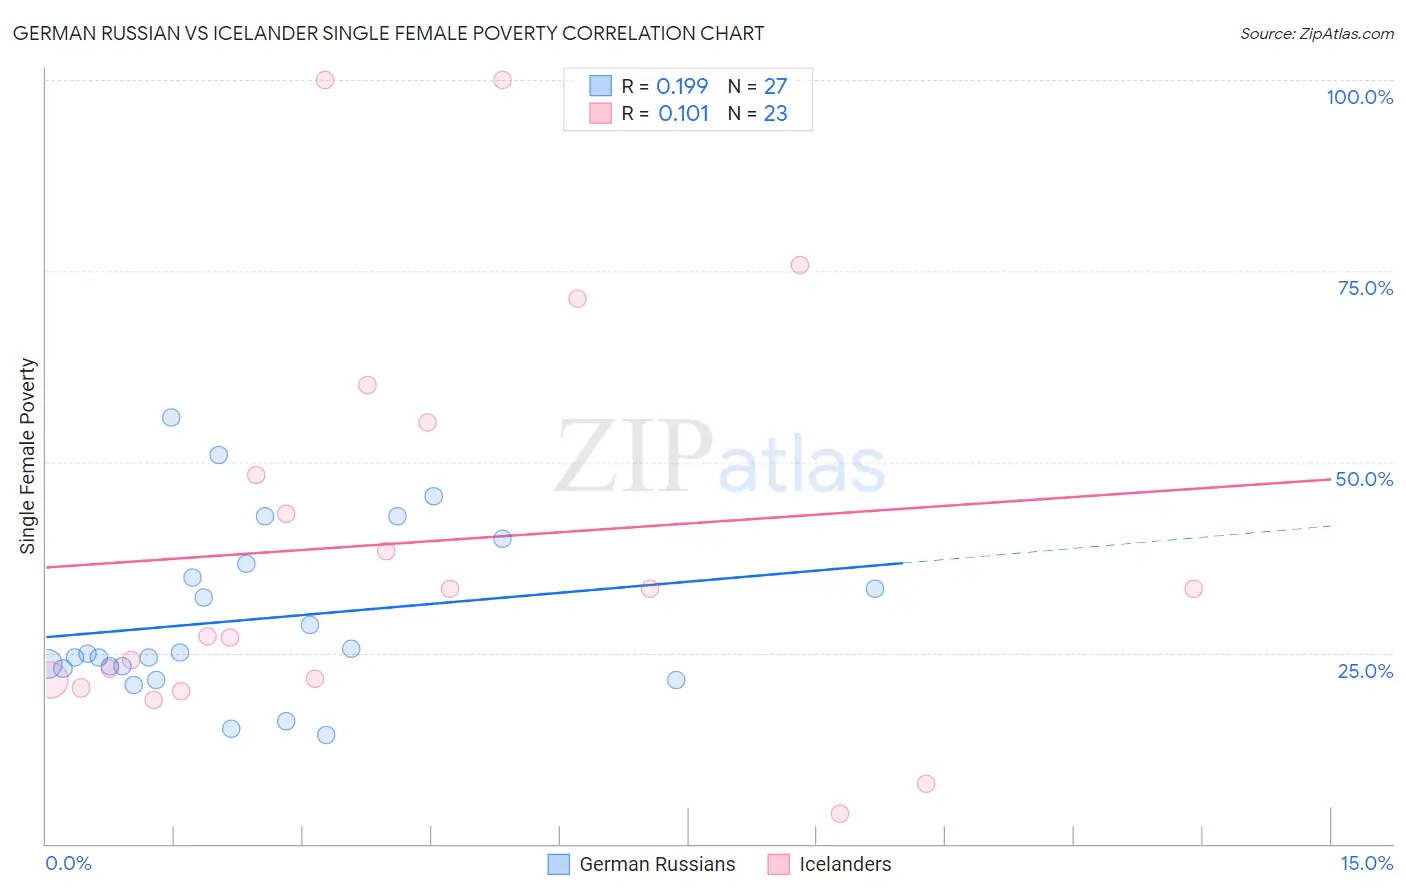
German Russian vs Icelander Single Female Poverty Correlation Chart
The statistical analysis conducted on geographies consisting of 96,093,035 people shows a poor positive correlation between the proportion of German Russians and poverty level among single females in the United States with a correlation coefficient (R) of 0.199 and weighted average of 23.9%. Similarly, the statistical analysis conducted on geographies consisting of 158,245,143 people shows a poor positive correlation between the proportion of Icelanders and poverty level among single females in the United States with a correlation coefficient (R) of 0.101 and weighted average of 21.6%, a difference of 10.6%.
Single Female Poverty Correlation Summary
| Measurement | German Russian | Icelander |
| Minimum | 14.3% | 3.9% |
| Maximum | 55.7% | 100.0% |
| Range | 41.4% | 96.1% |
| Mean | 29.4% | 39.4% |
| Median | 25.0% | 33.3% |
| Interquartile 25% (IQ1) | 22.9% | 21.4% |
| Interquartile 75% (IQ3) | 36.6% | 55.2% |
| Interquartile Range (IQR) | 13.7% | 33.8% |
| Standard Deviation (Sample) | 10.9% | 26.5% |
| Standard Deviation (Population) | 10.7% | 25.9% |
Similar Demographics by Single Female Poverty
Demographics Similar to German Russians by Single Female Poverty
In terms of single female poverty, the demographic groups most similar to German Russians are Immigrants from Dominica (23.9%, a difference of 0.11%), Guatemalan (23.8%, a difference of 0.14%), Immigrants from Zaire (23.8%, a difference of 0.20%), Immigrants from Latin America (23.7%, a difference of 0.71%), and Immigrants from Guatemala (24.1%, a difference of 0.97%).
| Demographics | Rating | Rank | Single Female Poverty |
| Immigrants | Azores | 0.0 /100 | #276 | Tragic 23.5% |
| Pennsylvania Germans | 0.0 /100 | #277 | Tragic 23.6% |
| Immigrants | Nonimmigrants | 0.0 /100 | #278 | Tragic 23.6% |
| Alaskan Athabascans | 0.0 /100 | #279 | Tragic 23.6% |
| Immigrants | Latin America | 0.0 /100 | #280 | Tragic 23.7% |
| Immigrants | Zaire | 0.0 /100 | #281 | Tragic 23.8% |
| Guatemalans | 0.0 /100 | #282 | Tragic 23.8% |
| German Russians | 0.0 /100 | #283 | Tragic 23.9% |
| Immigrants | Dominica | 0.0 /100 | #284 | Tragic 23.9% |
| Immigrants | Guatemala | 0.0 /100 | #285 | Tragic 24.1% |
| Cree | 0.0 /100 | #286 | Tragic 24.1% |
| Bangladeshis | 0.0 /100 | #287 | Tragic 24.2% |
| Spanish Americans | 0.0 /100 | #288 | Tragic 24.2% |
| U.S. Virgin Islanders | 0.0 /100 | #289 | Tragic 24.2% |
| Indonesians | 0.0 /100 | #290 | Tragic 24.3% |
Demographics Similar to Icelanders by Single Female Poverty
In terms of single female poverty, the demographic groups most similar to Icelanders are Jamaican (21.6%, a difference of 0.010%), Immigrants from Panama (21.6%, a difference of 0.040%), Guamanian/Chamorro (21.6%, a difference of 0.040%), Immigrants from Nicaragua (21.6%, a difference of 0.10%), and Immigrants from Eastern Africa (21.6%, a difference of 0.13%).
| Demographics | Rating | Rank | Single Female Poverty |
| Immigrants | Africa | 16.7 /100 | #204 | Poor 21.5% |
| Finns | 16.2 /100 | #205 | Poor 21.5% |
| Belgians | 16.1 /100 | #206 | Poor 21.5% |
| Ghanaians | 15.7 /100 | #207 | Poor 21.6% |
| Haitians | 15.4 /100 | #208 | Poor 21.6% |
| Immigrants | Eastern Africa | 15.1 /100 | #209 | Poor 21.6% |
| Immigrants | Panama | 14.4 /100 | #210 | Poor 21.6% |
| Icelanders | 14.0 /100 | #211 | Poor 21.6% |
| Jamaicans | 14.0 /100 | #212 | Poor 21.6% |
| Guamanians/Chamorros | 13.7 /100 | #213 | Poor 21.6% |
| Immigrants | Nicaragua | 13.3 /100 | #214 | Poor 21.6% |
| Ecuadorians | 12.3 /100 | #215 | Poor 21.6% |
| Immigrants | Barbados | 12.2 /100 | #216 | Poor 21.7% |
| Immigrants | St. Vincent and the Grenadines | 11.7 /100 | #217 | Poor 21.7% |
| Nepalese | 9.7 /100 | #218 | Tragic 21.7% |