Immigrants from Costa Rica vs Icelander Single Female Poverty
COMPARE
Immigrants from Costa Rica
Icelander
Single Female Poverty
Single Female Poverty Comparison
Immigrants from Costa Rica
Icelanders
20.9%
SINGLE FEMALE POVERTY
61.5/ 100
METRIC RATING
168th/ 347
METRIC RANK
21.6%
SINGLE FEMALE POVERTY
14.0/ 100
METRIC RATING
211th/ 347
METRIC RANK
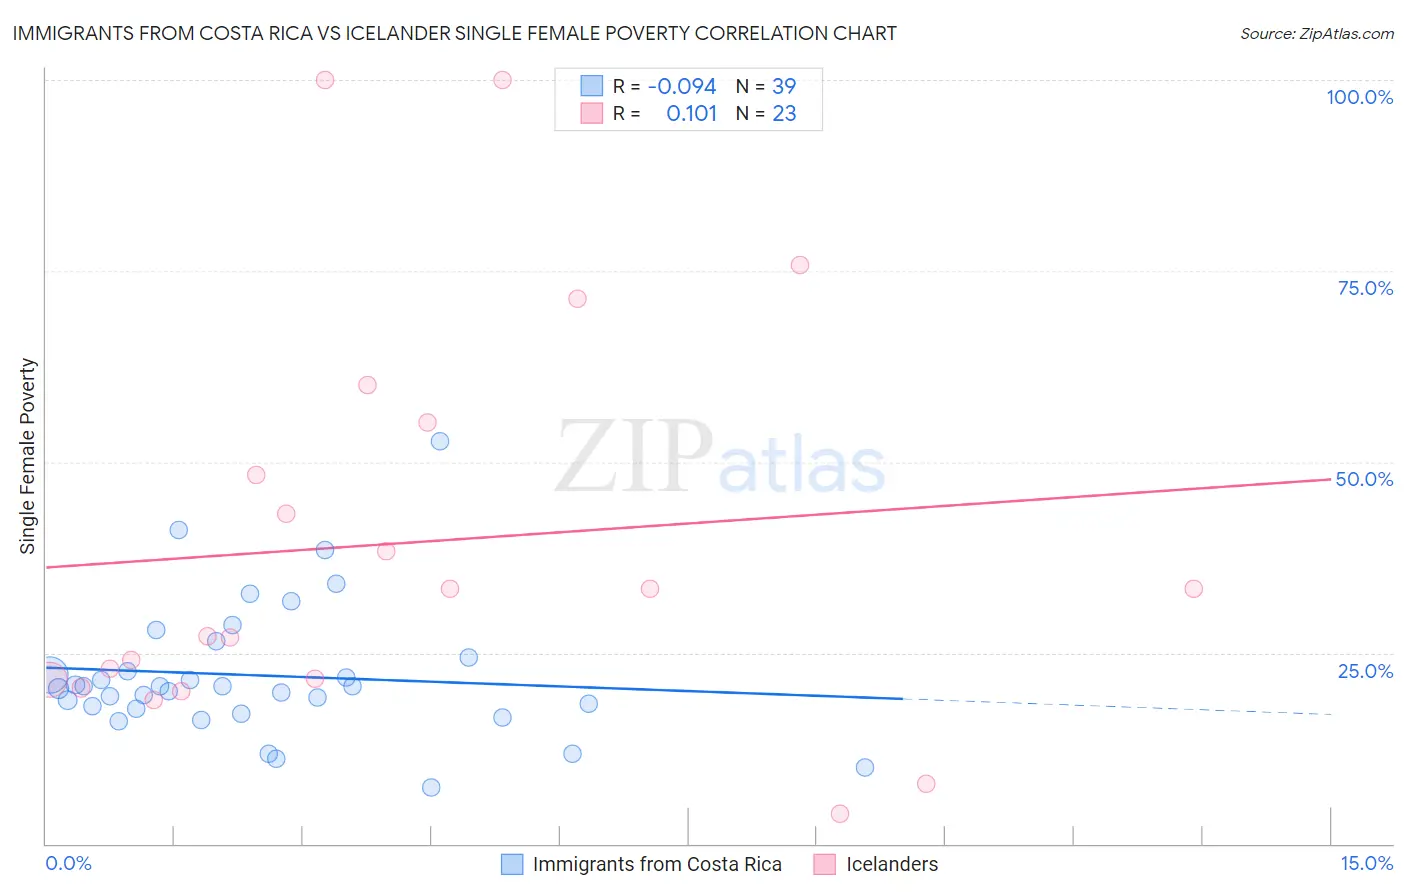
Immigrants from Costa Rica vs Icelander Single Female Poverty Correlation Chart
The statistical analysis conducted on geographies consisting of 202,952,607 people shows a slight negative correlation between the proportion of Immigrants from Costa Rica and poverty level among single females in the United States with a correlation coefficient (R) of -0.094 and weighted average of 20.9%. Similarly, the statistical analysis conducted on geographies consisting of 158,245,143 people shows a poor positive correlation between the proportion of Icelanders and poverty level among single females in the United States with a correlation coefficient (R) of 0.101 and weighted average of 21.6%, a difference of 3.6%.
Single Female Poverty Correlation Summary
| Measurement | Immigrants from Costa Rica | Icelander |
| Minimum | 7.4% | 3.9% |
| Maximum | 52.6% | 100.0% |
| Range | 45.2% | 96.1% |
| Mean | 22.0% | 39.4% |
| Median | 20.6% | 33.3% |
| Interquartile 25% (IQ1) | 17.6% | 21.4% |
| Interquartile 75% (IQ3) | 24.4% | 55.2% |
| Interquartile Range (IQR) | 6.8% | 33.8% |
| Standard Deviation (Sample) | 8.8% | 26.5% |
| Standard Deviation (Population) | 8.7% | 25.9% |
Similar Demographics by Single Female Poverty
Demographics Similar to Immigrants from Costa Rica by Single Female Poverty
In terms of single female poverty, the demographic groups most similar to Immigrants from Costa Rica are Immigrants from Norway (20.8%, a difference of 0.090%), Norwegian (20.8%, a difference of 0.10%), Ugandan (20.8%, a difference of 0.16%), Iraqi (20.8%, a difference of 0.20%), and Immigrants from Trinidad and Tobago (20.9%, a difference of 0.34%).
| Demographics | Rating | Rank | Single Female Poverty |
| Kenyans | 68.5 /100 | #161 | Good 20.8% |
| Northern Europeans | 68.4 /100 | #162 | Good 20.8% |
| Lebanese | 67.6 /100 | #163 | Good 20.8% |
| Iraqis | 64.5 /100 | #164 | Good 20.8% |
| Ugandans | 64.0 /100 | #165 | Good 20.8% |
| Norwegians | 63.0 /100 | #166 | Good 20.8% |
| Immigrants | Norway | 63.0 /100 | #167 | Good 20.8% |
| Immigrants | Costa Rica | 61.5 /100 | #168 | Good 20.9% |
| Immigrants | Trinidad and Tobago | 56.3 /100 | #169 | Average 20.9% |
| New Zealanders | 53.2 /100 | #170 | Average 21.0% |
| Moroccans | 52.8 /100 | #171 | Average 21.0% |
| Guyanese | 52.0 /100 | #172 | Average 21.0% |
| Immigrants | Guyana | 50.6 /100 | #173 | Average 21.0% |
| Cubans | 50.0 /100 | #174 | Average 21.0% |
| Czechs | 46.8 /100 | #175 | Average 21.0% |
Demographics Similar to Icelanders by Single Female Poverty
In terms of single female poverty, the demographic groups most similar to Icelanders are Jamaican (21.6%, a difference of 0.010%), Immigrants from Panama (21.6%, a difference of 0.040%), Guamanian/Chamorro (21.6%, a difference of 0.040%), Immigrants from Nicaragua (21.6%, a difference of 0.10%), and Immigrants from Eastern Africa (21.6%, a difference of 0.13%).
| Demographics | Rating | Rank | Single Female Poverty |
| Immigrants | Africa | 16.7 /100 | #204 | Poor 21.5% |
| Finns | 16.2 /100 | #205 | Poor 21.5% |
| Belgians | 16.1 /100 | #206 | Poor 21.5% |
| Ghanaians | 15.7 /100 | #207 | Poor 21.6% |
| Haitians | 15.4 /100 | #208 | Poor 21.6% |
| Immigrants | Eastern Africa | 15.1 /100 | #209 | Poor 21.6% |
| Immigrants | Panama | 14.4 /100 | #210 | Poor 21.6% |
| Icelanders | 14.0 /100 | #211 | Poor 21.6% |
| Jamaicans | 14.0 /100 | #212 | Poor 21.6% |
| Guamanians/Chamorros | 13.7 /100 | #213 | Poor 21.6% |
| Immigrants | Nicaragua | 13.3 /100 | #214 | Poor 21.6% |
| Ecuadorians | 12.3 /100 | #215 | Poor 21.6% |
| Immigrants | Barbados | 12.2 /100 | #216 | Poor 21.7% |
| Immigrants | St. Vincent and the Grenadines | 11.7 /100 | #217 | Poor 21.7% |
| Nepalese | 9.7 /100 | #218 | Tragic 21.7% |