Mexican vs Pima Child Poverty Under the Age of 16
COMPARE
Mexican
Pima
Child Poverty Under the Age of 16
Child Poverty Under the Age of 16 Comparison
Mexicans
Pima
20.7%
CHILD POVERTY UNDER THE AGE OF 16
0.0/ 100
METRIC RATING
295th/ 347
METRIC RANK
29.0%
CHILD POVERTY UNDER THE AGE OF 16
0.0/ 100
METRIC RATING
342nd/ 347
METRIC RANK
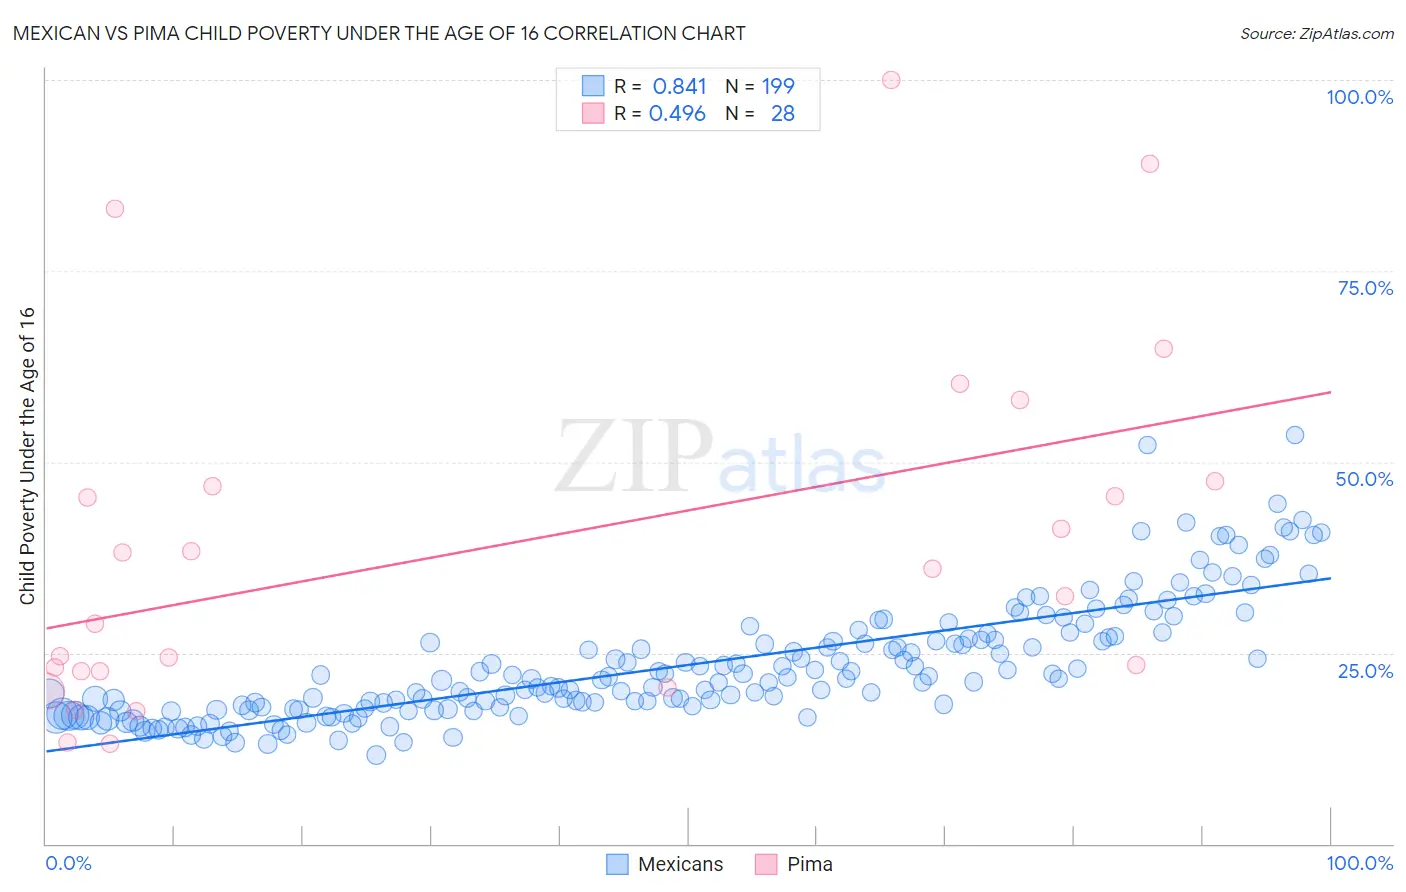
Mexican vs Pima Child Poverty Under the Age of 16 Correlation Chart
The statistical analysis conducted on geographies consisting of 554,745,806 people shows a very strong positive correlation between the proportion of Mexicans and poverty level among children under the age of 16 in the United States with a correlation coefficient (R) of 0.841 and weighted average of 20.7%. Similarly, the statistical analysis conducted on geographies consisting of 61,516,106 people shows a moderate positive correlation between the proportion of Pima and poverty level among children under the age of 16 in the United States with a correlation coefficient (R) of 0.496 and weighted average of 29.0%, a difference of 40.3%.
Child Poverty Under the Age of 16 Correlation Summary
| Measurement | Mexican | Pima |
| Minimum | 11.5% | 13.1% |
| Maximum | 53.6% | 100.0% |
| Range | 42.0% | 86.9% |
| Mean | 23.4% | 39.2% |
| Median | 21.4% | 34.2% |
| Interquartile 25% (IQ1) | 17.6% | 22.5% |
| Interquartile 75% (IQ3) | 26.8% | 47.1% |
| Interquartile Range (IQR) | 9.2% | 24.6% |
| Standard Deviation (Sample) | 7.8% | 23.2% |
| Standard Deviation (Population) | 7.7% | 22.7% |
Similar Demographics by Child Poverty Under the Age of 16
Demographics Similar to Mexicans by Child Poverty Under the Age of 16
In terms of child poverty under the age of 16, the demographic groups most similar to Mexicans are Haitian (20.7%, a difference of 0.14%), Immigrants from Senegal (20.6%, a difference of 0.34%), Immigrants from Caribbean (20.8%, a difference of 0.38%), Hispanic or Latino (20.8%, a difference of 0.51%), and Arapaho (20.8%, a difference of 0.51%).
| Demographics | Rating | Rank | Child Poverty Under the Age of 16 |
| Immigrants | Belize | 0.0 /100 | #288 | Tragic 20.3% |
| Senegalese | 0.0 /100 | #289 | Tragic 20.4% |
| Yaqui | 0.0 /100 | #290 | Tragic 20.4% |
| Chippewa | 0.0 /100 | #291 | Tragic 20.5% |
| Immigrants | Latin America | 0.0 /100 | #292 | Tragic 20.5% |
| Immigrants | Senegal | 0.0 /100 | #293 | Tragic 20.6% |
| Haitians | 0.0 /100 | #294 | Tragic 20.7% |
| Mexicans | 0.0 /100 | #295 | Tragic 20.7% |
| Immigrants | Caribbean | 0.0 /100 | #296 | Tragic 20.8% |
| Hispanics or Latinos | 0.0 /100 | #297 | Tragic 20.8% |
| Arapaho | 0.0 /100 | #298 | Tragic 20.8% |
| Immigrants | Haiti | 0.0 /100 | #299 | Tragic 20.9% |
| Indonesians | 0.0 /100 | #300 | Tragic 21.0% |
| Immigrants | Grenada | 0.0 /100 | #301 | Tragic 21.0% |
| Immigrants | Bahamas | 0.0 /100 | #302 | Tragic 21.0% |
Demographics Similar to Pima by Child Poverty Under the Age of 16
In terms of child poverty under the age of 16, the demographic groups most similar to Pima are Immigrants from Yemen (29.1%, a difference of 0.19%), Yuman (28.9%, a difference of 0.26%), Navajo (30.2%, a difference of 4.2%), Lumbee (31.0%, a difference of 6.8%), and Hopi (27.1%, a difference of 7.1%).
| Demographics | Rating | Rank | Child Poverty Under the Age of 16 |
| Immigrants | Dominican Republic | 0.0 /100 | #333 | Tragic 24.0% |
| Blacks/African Americans | 0.0 /100 | #334 | Tragic 24.4% |
| Houma | 0.0 /100 | #335 | Tragic 24.9% |
| Yup'ik | 0.0 /100 | #336 | Tragic 25.1% |
| Sioux | 0.0 /100 | #337 | Tragic 25.2% |
| Cheyenne | 0.0 /100 | #338 | Tragic 25.4% |
| Crow | 0.0 /100 | #339 | Tragic 26.0% |
| Hopi | 0.0 /100 | #340 | Tragic 27.1% |
| Yuman | 0.0 /100 | #341 | Tragic 28.9% |
| Pima | 0.0 /100 | #342 | Tragic 29.0% |
| Immigrants | Yemen | 0.0 /100 | #343 | Tragic 29.1% |
| Navajo | 0.0 /100 | #344 | Tragic 30.2% |
| Lumbee | 0.0 /100 | #345 | Tragic 31.0% |
| Tohono O'odham | 0.0 /100 | #346 | Tragic 31.7% |
| Puerto Ricans | 0.0 /100 | #347 | Tragic 32.5% |