Mexican vs Belizean Child Poverty Under the Age of 16
COMPARE
Mexican
Belizean
Child Poverty Under the Age of 16
Child Poverty Under the Age of 16 Comparison
Mexicans
Belizeans
20.7%
CHILD POVERTY UNDER THE AGE OF 16
0.0/ 100
METRIC RATING
295th/ 347
METRIC RANK
19.9%
CHILD POVERTY UNDER THE AGE OF 16
0.1/ 100
METRIC RATING
276th/ 347
METRIC RANK
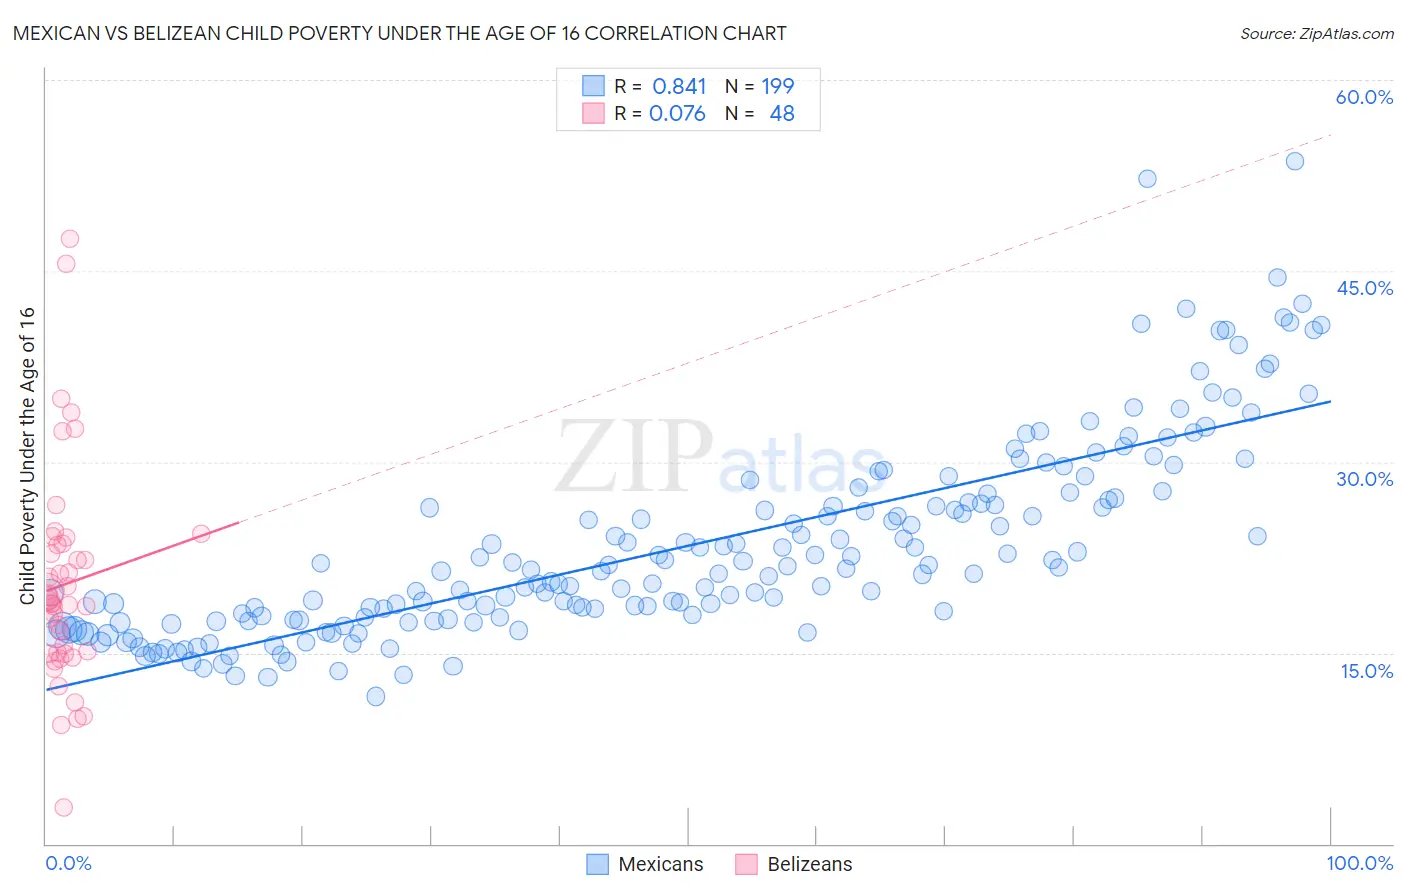
Mexican vs Belizean Child Poverty Under the Age of 16 Correlation Chart
The statistical analysis conducted on geographies consisting of 554,745,806 people shows a very strong positive correlation between the proportion of Mexicans and poverty level among children under the age of 16 in the United States with a correlation coefficient (R) of 0.841 and weighted average of 20.7%. Similarly, the statistical analysis conducted on geographies consisting of 143,921,177 people shows a slight positive correlation between the proportion of Belizeans and poverty level among children under the age of 16 in the United States with a correlation coefficient (R) of 0.076 and weighted average of 19.9%, a difference of 4.2%.
Child Poverty Under the Age of 16 Correlation Summary
| Measurement | Mexican | Belizean |
| Minimum | 11.5% | 2.9% |
| Maximum | 53.6% | 47.5% |
| Range | 42.0% | 44.7% |
| Mean | 23.4% | 20.4% |
| Median | 21.4% | 19.0% |
| Interquartile 25% (IQ1) | 17.6% | 15.0% |
| Interquartile 75% (IQ3) | 26.8% | 23.5% |
| Interquartile Range (IQR) | 9.2% | 8.6% |
| Standard Deviation (Sample) | 7.8% | 8.4% |
| Standard Deviation (Population) | 7.7% | 8.3% |
Demographics Similar to Mexicans and Belizeans by Child Poverty Under the Age of 16
In terms of child poverty under the age of 16, the demographic groups most similar to Mexicans are Haitian (20.7%, a difference of 0.14%), Immigrants from Senegal (20.6%, a difference of 0.34%), Immigrants from Latin America (20.5%, a difference of 0.77%), Chippewa (20.5%, a difference of 0.82%), and Yaqui (20.4%, a difference of 1.6%). Similarly, the demographic groups most similar to Belizeans are Immigrants from Barbados (19.9%, a difference of 0.0%), Iroquois (19.9%, a difference of 0.14%), Bangladeshi (19.9%, a difference of 0.24%), Subsaharan African (19.9%, a difference of 0.24%), and Comanche (19.9%, a difference of 0.25%).
| Demographics | Rating | Rank | Child Poverty Under the Age of 16 |
| Immigrants | Barbados | 0.1 /100 | #275 | Tragic 19.9% |
| Belizeans | 0.1 /100 | #276 | Tragic 19.9% |
| Iroquois | 0.1 /100 | #277 | Tragic 19.9% |
| Bangladeshis | 0.0 /100 | #278 | Tragic 19.9% |
| Sub-Saharan Africans | 0.0 /100 | #279 | Tragic 19.9% |
| Comanche | 0.0 /100 | #280 | Tragic 19.9% |
| Central Americans | 0.0 /100 | #281 | Tragic 20.0% |
| Barbadians | 0.0 /100 | #282 | Tragic 20.0% |
| Immigrants | Zaire | 0.0 /100 | #283 | Tragic 20.1% |
| West Indians | 0.0 /100 | #284 | Tragic 20.1% |
| Immigrants | St. Vincent and the Grenadines | 0.0 /100 | #285 | Tragic 20.1% |
| Immigrants | West Indies | 0.0 /100 | #286 | Tragic 20.2% |
| Blackfeet | 0.0 /100 | #287 | Tragic 20.2% |
| Immigrants | Belize | 0.0 /100 | #288 | Tragic 20.3% |
| Senegalese | 0.0 /100 | #289 | Tragic 20.4% |
| Yaqui | 0.0 /100 | #290 | Tragic 20.4% |
| Chippewa | 0.0 /100 | #291 | Tragic 20.5% |
| Immigrants | Latin America | 0.0 /100 | #292 | Tragic 20.5% |
| Immigrants | Senegal | 0.0 /100 | #293 | Tragic 20.6% |
| Haitians | 0.0 /100 | #294 | Tragic 20.7% |
| Mexicans | 0.0 /100 | #295 | Tragic 20.7% |