Mexican vs Immigrants from Sri Lanka Child Poverty Under the Age of 16
COMPARE
Mexican
Immigrants from Sri Lanka
Child Poverty Under the Age of 16
Child Poverty Under the Age of 16 Comparison
Mexicans
Immigrants from Sri Lanka
20.7%
CHILD POVERTY UNDER THE AGE OF 16
0.0/ 100
METRIC RATING
295th/ 347
METRIC RANK
13.8%
CHILD POVERTY UNDER THE AGE OF 16
99.3/ 100
METRIC RATING
42nd/ 347
METRIC RANK
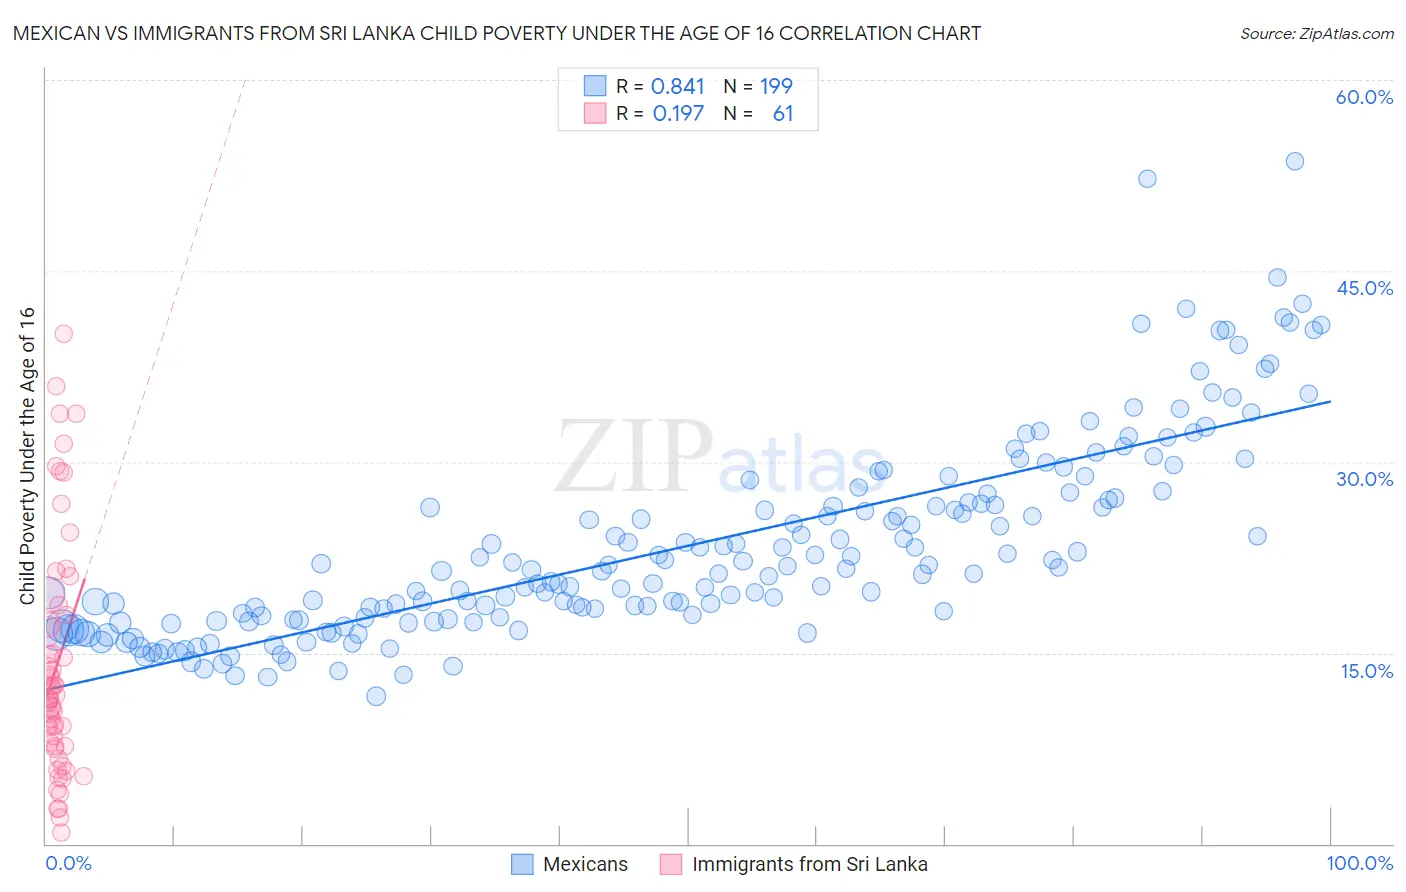
Mexican vs Immigrants from Sri Lanka Child Poverty Under the Age of 16 Correlation Chart
The statistical analysis conducted on geographies consisting of 554,745,806 people shows a very strong positive correlation between the proportion of Mexicans and poverty level among children under the age of 16 in the United States with a correlation coefficient (R) of 0.841 and weighted average of 20.7%. Similarly, the statistical analysis conducted on geographies consisting of 149,197,772 people shows a poor positive correlation between the proportion of Immigrants from Sri Lanka and poverty level among children under the age of 16 in the United States with a correlation coefficient (R) of 0.197 and weighted average of 13.8%, a difference of 50.3%.
Child Poverty Under the Age of 16 Correlation Summary
| Measurement | Mexican | Immigrants from Sri Lanka |
| Minimum | 11.5% | 0.87% |
| Maximum | 53.6% | 40.1% |
| Range | 42.0% | 39.2% |
| Mean | 23.4% | 14.1% |
| Median | 21.4% | 11.4% |
| Interquartile 25% (IQ1) | 17.6% | 7.6% |
| Interquartile 75% (IQ3) | 26.8% | 18.4% |
| Interquartile Range (IQR) | 9.2% | 10.7% |
| Standard Deviation (Sample) | 7.8% | 9.2% |
| Standard Deviation (Population) | 7.7% | 9.2% |
Similar Demographics by Child Poverty Under the Age of 16
Demographics Similar to Mexicans by Child Poverty Under the Age of 16
In terms of child poverty under the age of 16, the demographic groups most similar to Mexicans are Haitian (20.7%, a difference of 0.14%), Immigrants from Senegal (20.6%, a difference of 0.34%), Immigrants from Caribbean (20.8%, a difference of 0.38%), Hispanic or Latino (20.8%, a difference of 0.51%), and Arapaho (20.8%, a difference of 0.51%).
| Demographics | Rating | Rank | Child Poverty Under the Age of 16 |
| Immigrants | Belize | 0.0 /100 | #288 | Tragic 20.3% |
| Senegalese | 0.0 /100 | #289 | Tragic 20.4% |
| Yaqui | 0.0 /100 | #290 | Tragic 20.4% |
| Chippewa | 0.0 /100 | #291 | Tragic 20.5% |
| Immigrants | Latin America | 0.0 /100 | #292 | Tragic 20.5% |
| Immigrants | Senegal | 0.0 /100 | #293 | Tragic 20.6% |
| Haitians | 0.0 /100 | #294 | Tragic 20.7% |
| Mexicans | 0.0 /100 | #295 | Tragic 20.7% |
| Immigrants | Caribbean | 0.0 /100 | #296 | Tragic 20.8% |
| Hispanics or Latinos | 0.0 /100 | #297 | Tragic 20.8% |
| Arapaho | 0.0 /100 | #298 | Tragic 20.8% |
| Immigrants | Haiti | 0.0 /100 | #299 | Tragic 20.9% |
| Indonesians | 0.0 /100 | #300 | Tragic 21.0% |
| Immigrants | Grenada | 0.0 /100 | #301 | Tragic 21.0% |
| Immigrants | Bahamas | 0.0 /100 | #302 | Tragic 21.0% |
Demographics Similar to Immigrants from Sri Lanka by Child Poverty Under the Age of 16
In terms of child poverty under the age of 16, the demographic groups most similar to Immigrants from Sri Lanka are Immigrants from Moldova (13.8%, a difference of 0.060%), Croatian (13.8%, a difference of 0.080%), Greek (13.8%, a difference of 0.23%), Immigrants from Scotland (13.7%, a difference of 0.24%), and Czech (13.8%, a difference of 0.29%).
| Demographics | Rating | Rank | Child Poverty Under the Age of 16 |
| Lithuanians | 99.6 /100 | #35 | Exceptional 13.5% |
| Immigrants | Northern Europe | 99.6 /100 | #36 | Exceptional 13.6% |
| Immigrants | Bolivia | 99.6 /100 | #37 | Exceptional 13.6% |
| Luxembourgers | 99.5 /100 | #38 | Exceptional 13.6% |
| Immigrants | Australia | 99.5 /100 | #39 | Exceptional 13.6% |
| Immigrants | Scotland | 99.4 /100 | #40 | Exceptional 13.7% |
| Croatians | 99.4 /100 | #41 | Exceptional 13.8% |
| Immigrants | Sri Lanka | 99.3 /100 | #42 | Exceptional 13.8% |
| Immigrants | Moldova | 99.3 /100 | #43 | Exceptional 13.8% |
| Greeks | 99.3 /100 | #44 | Exceptional 13.8% |
| Czechs | 99.3 /100 | #45 | Exceptional 13.8% |
| Immigrants | Asia | 99.2 /100 | #46 | Exceptional 13.8% |
| Estonians | 99.2 /100 | #47 | Exceptional 13.9% |
| Koreans | 99.2 /100 | #48 | Exceptional 13.9% |
| Italians | 99.2 /100 | #49 | Exceptional 13.9% |