Subsaharan African vs Pima Child Poverty Under the Age of 16
COMPARE
Subsaharan African
Pima
Child Poverty Under the Age of 16
Child Poverty Under the Age of 16 Comparison
Sub-Saharan Africans
Pima
19.9%
CHILD POVERTY UNDER THE AGE OF 16
0.0/ 100
METRIC RATING
279th/ 347
METRIC RANK
29.0%
CHILD POVERTY UNDER THE AGE OF 16
0.0/ 100
METRIC RATING
342nd/ 347
METRIC RANK
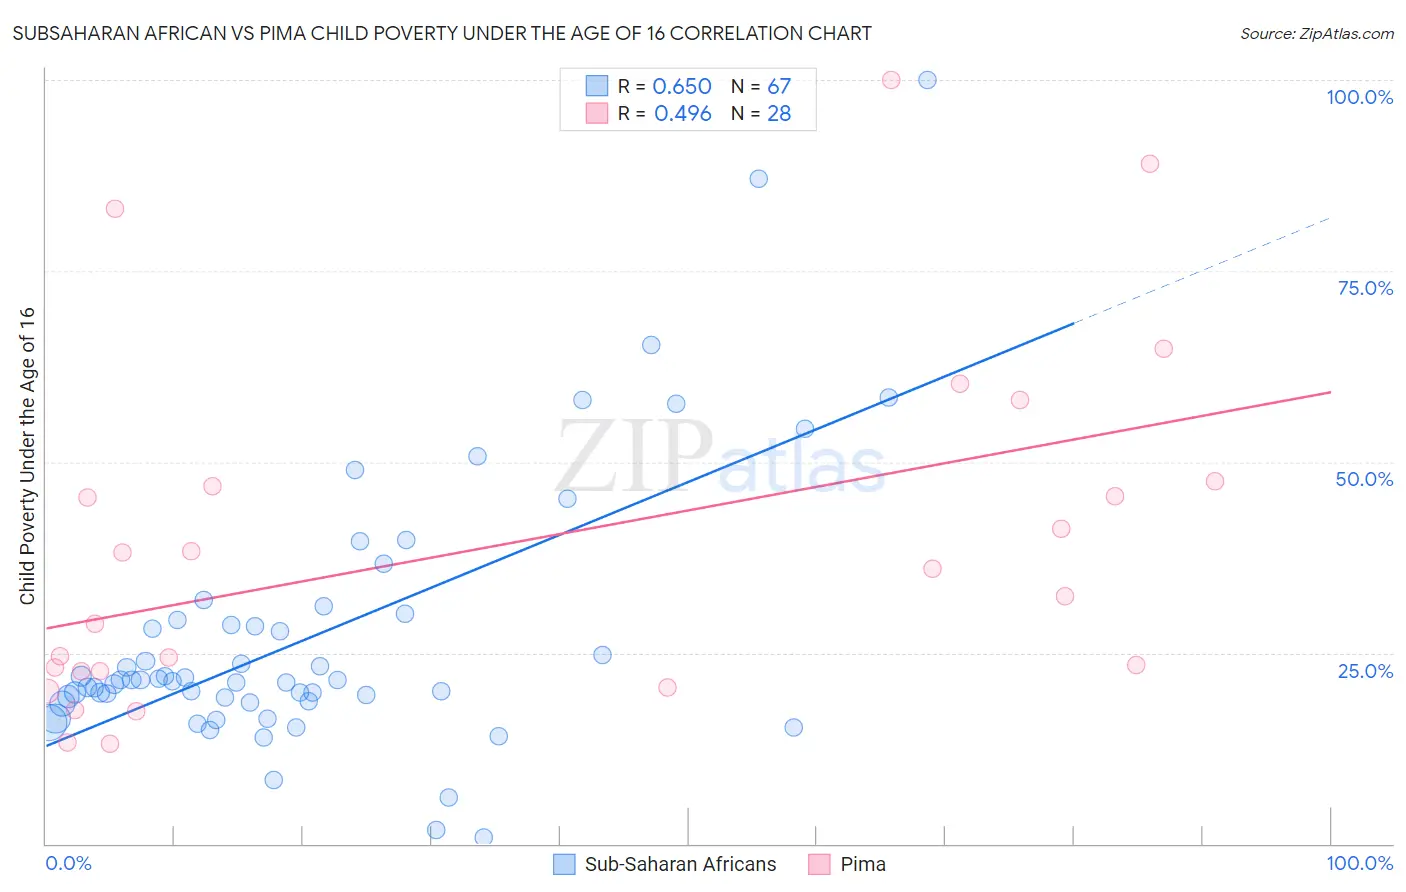
Subsaharan African vs Pima Child Poverty Under the Age of 16 Correlation Chart
The statistical analysis conducted on geographies consisting of 502,334,948 people shows a significant positive correlation between the proportion of Sub-Saharan Africans and poverty level among children under the age of 16 in the United States with a correlation coefficient (R) of 0.650 and weighted average of 19.9%. Similarly, the statistical analysis conducted on geographies consisting of 61,516,106 people shows a moderate positive correlation between the proportion of Pima and poverty level among children under the age of 16 in the United States with a correlation coefficient (R) of 0.496 and weighted average of 29.0%, a difference of 45.8%.
Child Poverty Under the Age of 16 Correlation Summary
| Measurement | Subsaharan African | Pima |
| Minimum | 0.88% | 13.1% |
| Maximum | 100.0% | 100.0% |
| Range | 99.1% | 86.9% |
| Mean | 27.1% | 39.2% |
| Median | 21.4% | 34.2% |
| Interquartile 25% (IQ1) | 18.7% | 22.5% |
| Interquartile 75% (IQ3) | 29.3% | 47.1% |
| Interquartile Range (IQR) | 10.6% | 24.6% |
| Standard Deviation (Sample) | 17.7% | 23.2% |
| Standard Deviation (Population) | 17.5% | 22.7% |
Similar Demographics by Child Poverty Under the Age of 16
Demographics Similar to Sub-Saharan Africans by Child Poverty Under the Age of 16
In terms of child poverty under the age of 16, the demographic groups most similar to Sub-Saharan Africans are Bangladeshi (19.9%, a difference of 0.010%), Comanche (19.9%, a difference of 0.010%), Iroquois (19.9%, a difference of 0.10%), Belizean (19.9%, a difference of 0.24%), and Immigrants from Cabo Verde (19.9%, a difference of 0.25%).
| Demographics | Rating | Rank | Child Poverty Under the Age of 16 |
| Immigrants | Bangladesh | 0.1 /100 | #272 | Tragic 19.8% |
| Immigrants | Jamaica | 0.1 /100 | #273 | Tragic 19.8% |
| Immigrants | Cabo Verde | 0.1 /100 | #274 | Tragic 19.9% |
| Immigrants | Barbados | 0.1 /100 | #275 | Tragic 19.9% |
| Belizeans | 0.1 /100 | #276 | Tragic 19.9% |
| Iroquois | 0.1 /100 | #277 | Tragic 19.9% |
| Bangladeshis | 0.0 /100 | #278 | Tragic 19.9% |
| Sub-Saharan Africans | 0.0 /100 | #279 | Tragic 19.9% |
| Comanche | 0.0 /100 | #280 | Tragic 19.9% |
| Central Americans | 0.0 /100 | #281 | Tragic 20.0% |
| Barbadians | 0.0 /100 | #282 | Tragic 20.0% |
| Immigrants | Zaire | 0.0 /100 | #283 | Tragic 20.1% |
| West Indians | 0.0 /100 | #284 | Tragic 20.1% |
| Immigrants | St. Vincent and the Grenadines | 0.0 /100 | #285 | Tragic 20.1% |
| Immigrants | West Indies | 0.0 /100 | #286 | Tragic 20.2% |
Demographics Similar to Pima by Child Poverty Under the Age of 16
In terms of child poverty under the age of 16, the demographic groups most similar to Pima are Immigrants from Yemen (29.1%, a difference of 0.19%), Yuman (28.9%, a difference of 0.26%), Navajo (30.2%, a difference of 4.2%), Lumbee (31.0%, a difference of 6.8%), and Hopi (27.1%, a difference of 7.1%).
| Demographics | Rating | Rank | Child Poverty Under the Age of 16 |
| Immigrants | Dominican Republic | 0.0 /100 | #333 | Tragic 24.0% |
| Blacks/African Americans | 0.0 /100 | #334 | Tragic 24.4% |
| Houma | 0.0 /100 | #335 | Tragic 24.9% |
| Yup'ik | 0.0 /100 | #336 | Tragic 25.1% |
| Sioux | 0.0 /100 | #337 | Tragic 25.2% |
| Cheyenne | 0.0 /100 | #338 | Tragic 25.4% |
| Crow | 0.0 /100 | #339 | Tragic 26.0% |
| Hopi | 0.0 /100 | #340 | Tragic 27.1% |
| Yuman | 0.0 /100 | #341 | Tragic 28.9% |
| Pima | 0.0 /100 | #342 | Tragic 29.0% |
| Immigrants | Yemen | 0.0 /100 | #343 | Tragic 29.1% |
| Navajo | 0.0 /100 | #344 | Tragic 30.2% |
| Lumbee | 0.0 /100 | #345 | Tragic 31.0% |
| Tohono O'odham | 0.0 /100 | #346 | Tragic 31.7% |
| Puerto Ricans | 0.0 /100 | #347 | Tragic 32.5% |