Mexican vs Immigrants from Belize Child Poverty Under the Age of 16
COMPARE
Mexican
Immigrants from Belize
Child Poverty Under the Age of 16
Child Poverty Under the Age of 16 Comparison
Mexicans
Immigrants from Belize
20.7%
CHILD POVERTY UNDER THE AGE OF 16
0.0/ 100
METRIC RATING
295th/ 347
METRIC RANK
20.3%
CHILD POVERTY UNDER THE AGE OF 16
0.0/ 100
METRIC RATING
288th/ 347
METRIC RANK
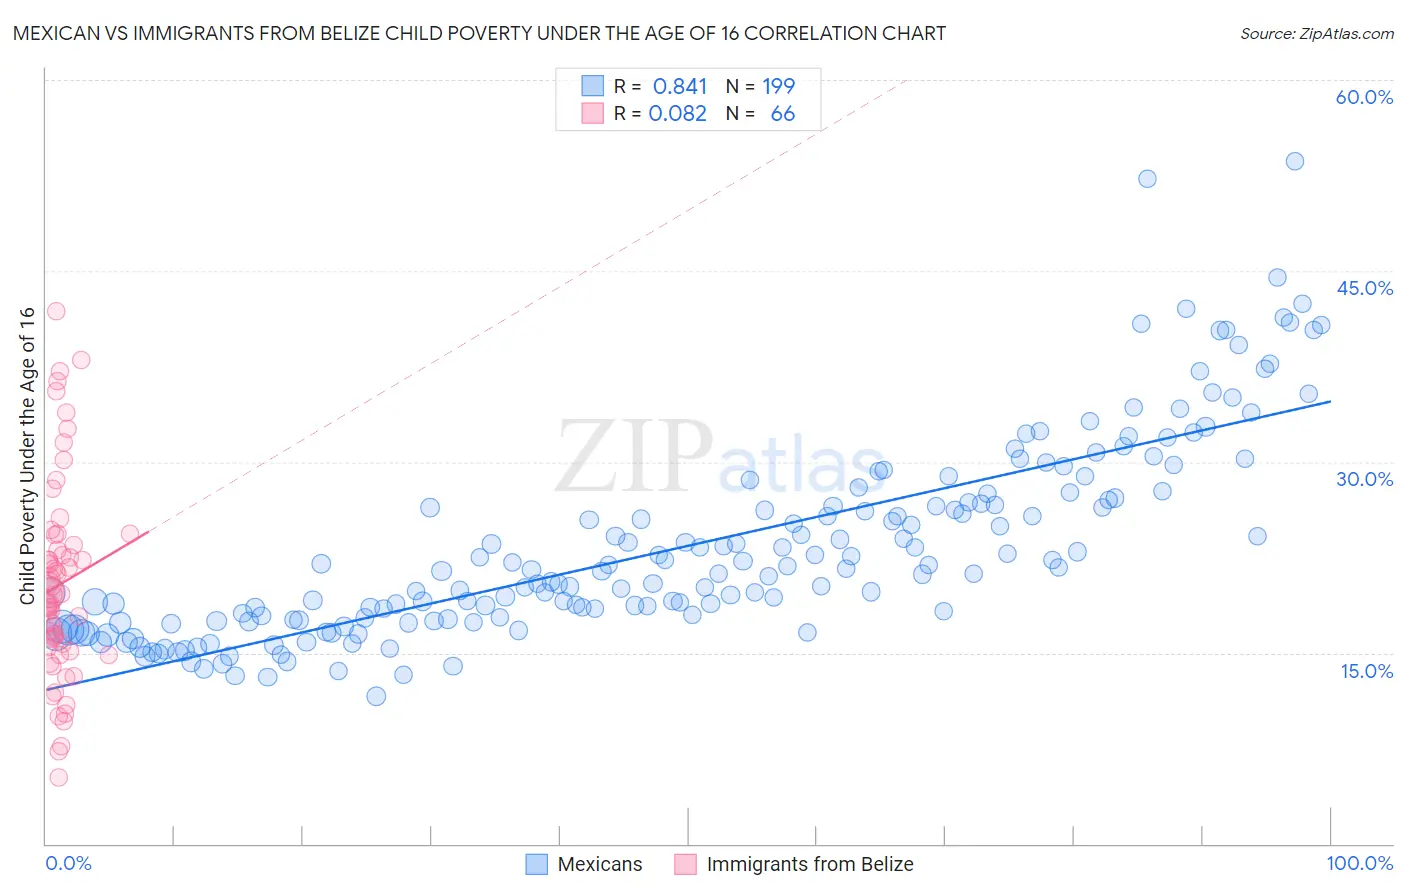
Mexican vs Immigrants from Belize Child Poverty Under the Age of 16 Correlation Chart
The statistical analysis conducted on geographies consisting of 554,745,806 people shows a very strong positive correlation between the proportion of Mexicans and poverty level among children under the age of 16 in the United States with a correlation coefficient (R) of 0.841 and weighted average of 20.7%. Similarly, the statistical analysis conducted on geographies consisting of 130,133,113 people shows a slight positive correlation between the proportion of Immigrants from Belize and poverty level among children under the age of 16 in the United States with a correlation coefficient (R) of 0.082 and weighted average of 20.3%, a difference of 1.8%.
Child Poverty Under the Age of 16 Correlation Summary
| Measurement | Mexican | Immigrants from Belize |
| Minimum | 11.5% | 5.2% |
| Maximum | 53.6% | 41.9% |
| Range | 42.0% | 36.7% |
| Mean | 23.4% | 20.4% |
| Median | 21.4% | 19.6% |
| Interquartile 25% (IQ1) | 17.6% | 15.4% |
| Interquartile 75% (IQ3) | 26.8% | 23.5% |
| Interquartile Range (IQR) | 9.2% | 8.1% |
| Standard Deviation (Sample) | 7.8% | 7.8% |
| Standard Deviation (Population) | 7.7% | 7.7% |
Demographics Similar to Mexicans and Immigrants from Belize by Child Poverty Under the Age of 16
In terms of child poverty under the age of 16, the demographic groups most similar to Mexicans are Haitian (20.7%, a difference of 0.14%), Immigrants from Senegal (20.6%, a difference of 0.34%), Immigrants from Caribbean (20.8%, a difference of 0.38%), Hispanic or Latino (20.8%, a difference of 0.51%), and Arapaho (20.8%, a difference of 0.51%). Similarly, the demographic groups most similar to Immigrants from Belize are Senegalese (20.4%, a difference of 0.24%), Yaqui (20.4%, a difference of 0.28%), Blackfeet (20.2%, a difference of 0.59%), Immigrants from West Indies (20.2%, a difference of 0.71%), and Immigrants from St. Vincent and the Grenadines (20.1%, a difference of 0.85%).
| Demographics | Rating | Rank | Child Poverty Under the Age of 16 |
| Central Americans | 0.0 /100 | #281 | Tragic 20.0% |
| Barbadians | 0.0 /100 | #282 | Tragic 20.0% |
| Immigrants | Zaire | 0.0 /100 | #283 | Tragic 20.1% |
| West Indians | 0.0 /100 | #284 | Tragic 20.1% |
| Immigrants | St. Vincent and the Grenadines | 0.0 /100 | #285 | Tragic 20.1% |
| Immigrants | West Indies | 0.0 /100 | #286 | Tragic 20.2% |
| Blackfeet | 0.0 /100 | #287 | Tragic 20.2% |
| Immigrants | Belize | 0.0 /100 | #288 | Tragic 20.3% |
| Senegalese | 0.0 /100 | #289 | Tragic 20.4% |
| Yaqui | 0.0 /100 | #290 | Tragic 20.4% |
| Chippewa | 0.0 /100 | #291 | Tragic 20.5% |
| Immigrants | Latin America | 0.0 /100 | #292 | Tragic 20.5% |
| Immigrants | Senegal | 0.0 /100 | #293 | Tragic 20.6% |
| Haitians | 0.0 /100 | #294 | Tragic 20.7% |
| Mexicans | 0.0 /100 | #295 | Tragic 20.7% |
| Immigrants | Caribbean | 0.0 /100 | #296 | Tragic 20.8% |
| Hispanics or Latinos | 0.0 /100 | #297 | Tragic 20.8% |
| Arapaho | 0.0 /100 | #298 | Tragic 20.8% |
| Immigrants | Haiti | 0.0 /100 | #299 | Tragic 20.9% |
| Indonesians | 0.0 /100 | #300 | Tragic 21.0% |
| Immigrants | Grenada | 0.0 /100 | #301 | Tragic 21.0% |