Mexican vs Pima In Labor Force | Age 30-34
COMPARE
Mexican
Pima
In Labor Force | Age 30-34
In Labor Force | Age 30-34 Comparison
Mexicans
Pima
81.9%
IN LABOR FORCE | AGE 30-34
0.0/ 100
METRIC RATING
312th/ 347
METRIC RANK
79.0%
IN LABOR FORCE | AGE 30-34
0.0/ 100
METRIC RATING
338th/ 347
METRIC RANK
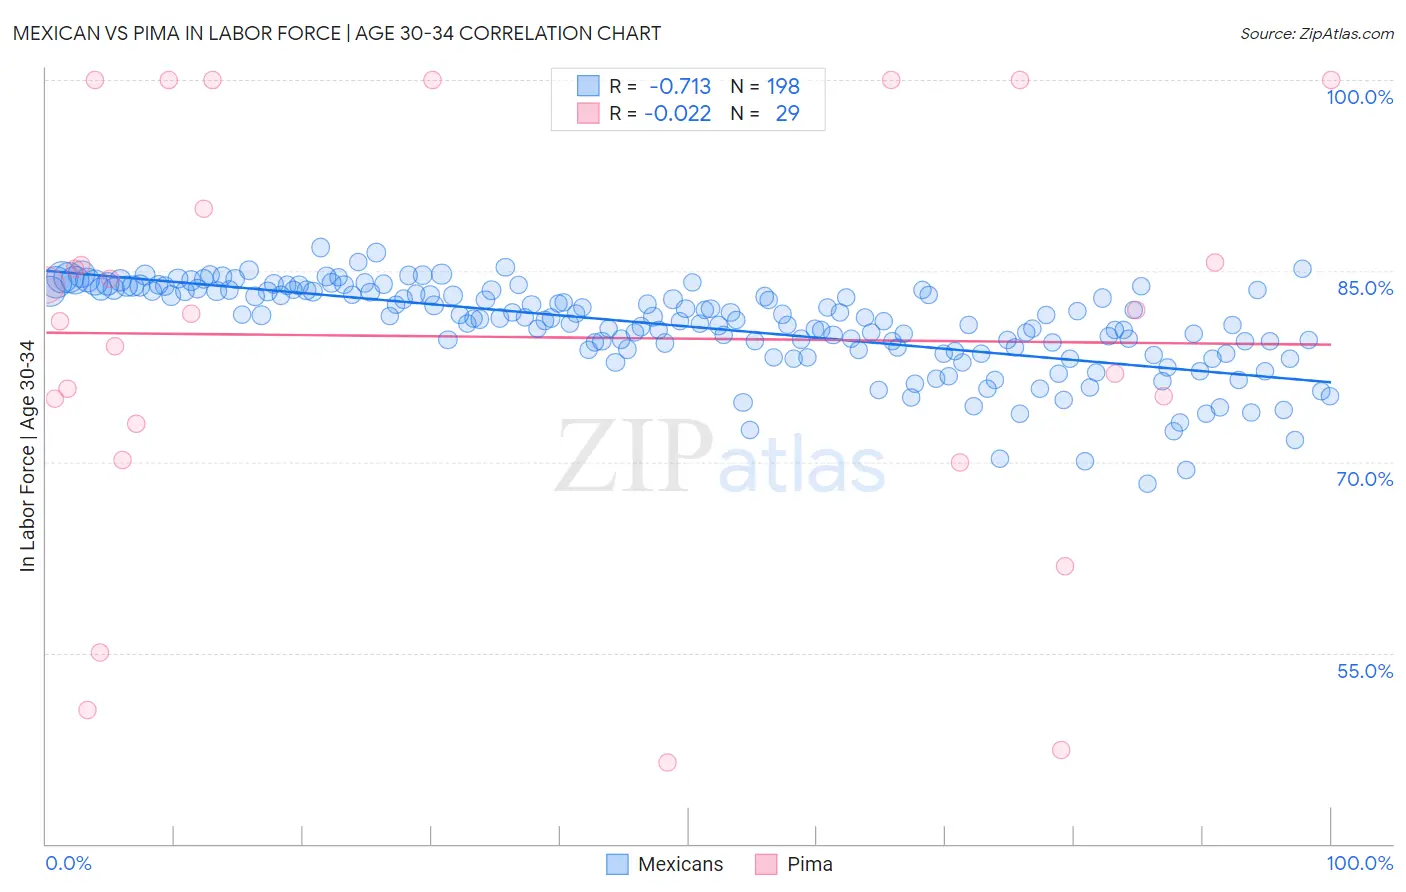
Mexican vs Pima In Labor Force | Age 30-34 Correlation Chart
The statistical analysis conducted on geographies consisting of 564,037,152 people shows a strong negative correlation between the proportion of Mexicans and labor force participation rate among population between the ages 30 and 34 in the United States with a correlation coefficient (R) of -0.713 and weighted average of 81.9%. Similarly, the statistical analysis conducted on geographies consisting of 61,528,436 people shows no correlation between the proportion of Pima and labor force participation rate among population between the ages 30 and 34 in the United States with a correlation coefficient (R) of -0.022 and weighted average of 79.0%, a difference of 3.6%.
In Labor Force | Age 30-34 Correlation Summary
| Measurement | Mexican | Pima |
| Minimum | 68.3% | 46.4% |
| Maximum | 86.8% | 100.0% |
| Range | 18.5% | 53.6% |
| Mean | 80.7% | 79.8% |
| Median | 81.3% | 81.6% |
| Interquartile 25% (IQ1) | 78.8% | 71.6% |
| Interquartile 75% (IQ3) | 83.5% | 95.0% |
| Interquartile Range (IQR) | 4.6% | 23.4% |
| Standard Deviation (Sample) | 3.5% | 16.2% |
| Standard Deviation (Population) | 3.5% | 15.9% |
Similar Demographics by In Labor Force | Age 30-34
Demographics Similar to Mexicans by In Labor Force | Age 30-34
In terms of in labor force | age 30-34, the demographic groups most similar to Mexicans are Chickasaw (81.9%, a difference of 0.0%), Iroquois (81.9%, a difference of 0.020%), Cajun (82.0%, a difference of 0.050%), Immigrants from Mexico (82.0%, a difference of 0.070%), and Puget Sound Salish (82.1%, a difference of 0.24%).
| Demographics | Rating | Rank | In Labor Force | Age 30-34 |
| Osage | 0.0 /100 | #305 | Tragic 82.3% |
| Spanish American Indians | 0.0 /100 | #306 | Tragic 82.2% |
| Menominee | 0.0 /100 | #307 | Tragic 82.2% |
| Puget Sound Salish | 0.0 /100 | #308 | Tragic 82.1% |
| Immigrants | Mexico | 0.0 /100 | #309 | Tragic 82.0% |
| Cajuns | 0.0 /100 | #310 | Tragic 82.0% |
| Chickasaw | 0.0 /100 | #311 | Tragic 81.9% |
| Mexicans | 0.0 /100 | #312 | Tragic 81.9% |
| Iroquois | 0.0 /100 | #313 | Tragic 81.9% |
| Alaskan Athabascans | 0.0 /100 | #314 | Tragic 81.7% |
| Cherokee | 0.0 /100 | #315 | Tragic 81.6% |
| Immigrants | Azores | 0.0 /100 | #316 | Tragic 81.5% |
| Arapaho | 0.0 /100 | #317 | Tragic 81.5% |
| Choctaw | 0.0 /100 | #318 | Tragic 81.4% |
| Shoshone | 0.0 /100 | #319 | Tragic 81.4% |
Demographics Similar to Pima by In Labor Force | Age 30-34
In terms of in labor force | age 30-34, the demographic groups most similar to Pima are Apache (79.0%, a difference of 0.030%), Yakama (79.1%, a difference of 0.12%), Ute (78.9%, a difference of 0.13%), Native/Alaskan (79.2%, a difference of 0.16%), and Marshallese (79.2%, a difference of 0.24%).
| Demographics | Rating | Rank | In Labor Force | Age 30-34 |
| Houma | 0.0 /100 | #331 | Tragic 79.9% |
| Kiowa | 0.0 /100 | #332 | Tragic 79.8% |
| Inupiat | 0.0 /100 | #333 | Tragic 79.7% |
| Hopi | 0.0 /100 | #334 | Tragic 79.3% |
| Marshallese | 0.0 /100 | #335 | Tragic 79.2% |
| Natives/Alaskans | 0.0 /100 | #336 | Tragic 79.2% |
| Yakama | 0.0 /100 | #337 | Tragic 79.1% |
| Pima | 0.0 /100 | #338 | Tragic 79.0% |
| Apache | 0.0 /100 | #339 | Tragic 79.0% |
| Ute | 0.0 /100 | #340 | Tragic 78.9% |
| Immigrants | Yemen | 0.0 /100 | #341 | Tragic 78.2% |
| Tohono O'odham | 0.0 /100 | #342 | Tragic 77.7% |
| Lumbee | 0.0 /100 | #343 | Tragic 77.3% |
| Yuman | 0.0 /100 | #344 | Tragic 77.1% |
| Yup'ik | 0.0 /100 | #345 | Tragic 76.4% |