Cherokee vs Blackfeet Single Mother Poverty
COMPARE
Cherokee
Blackfeet
Single Mother Poverty
Single Mother Poverty Comparison
Cherokee
Blackfeet
34.5%
SINGLE MOTHER POVERTY
0.0/ 100
METRIC RATING
317th/ 347
METRIC RANK
33.2%
SINGLE MOTHER POVERTY
0.0/ 100
METRIC RATING
296th/ 347
METRIC RANK
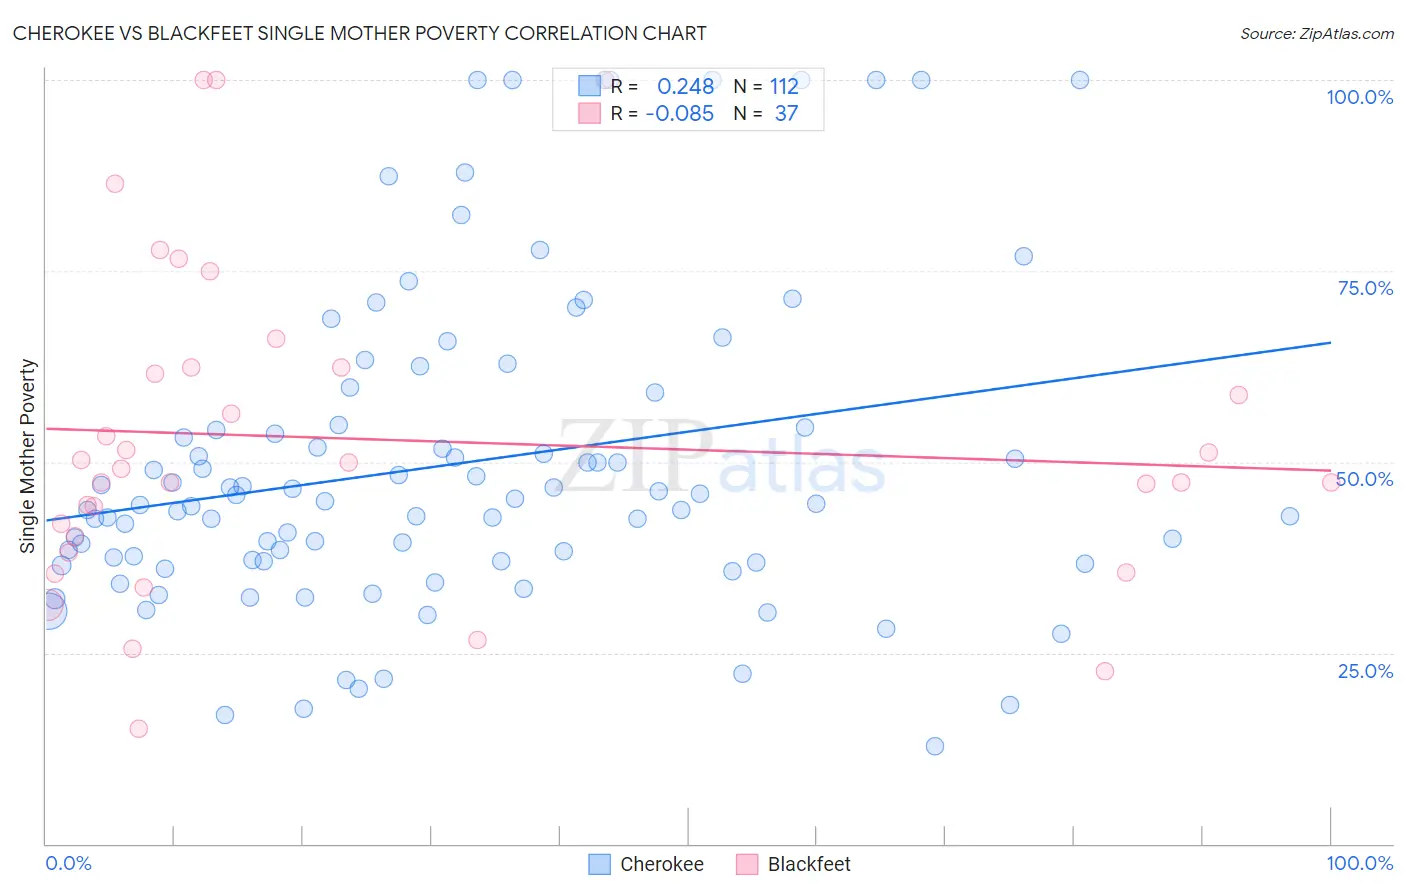
Cherokee vs Blackfeet Single Mother Poverty Correlation Chart
The statistical analysis conducted on geographies consisting of 479,873,905 people shows a weak positive correlation between the proportion of Cherokee and poverty level among single mothers in the United States with a correlation coefficient (R) of 0.248 and weighted average of 34.5%. Similarly, the statistical analysis conducted on geographies consisting of 305,769,036 people shows a slight negative correlation between the proportion of Blackfeet and poverty level among single mothers in the United States with a correlation coefficient (R) of -0.085 and weighted average of 33.2%, a difference of 4.0%.
Single Mother Poverty Correlation Summary
| Measurement | Cherokee | Blackfeet |
| Minimum | 12.7% | 15.0% |
| Maximum | 100.0% | 100.0% |
| Range | 87.3% | 85.0% |
| Mean | 49.7% | 53.0% |
| Median | 44.6% | 49.2% |
| Interquartile 25% (IQ1) | 37.0% | 39.3% |
| Interquartile 75% (IQ3) | 54.7% | 62.4% |
| Interquartile Range (IQR) | 17.6% | 23.1% |
| Standard Deviation (Sample) | 20.8% | 21.1% |
| Standard Deviation (Population) | 20.7% | 20.8% |
Similar Demographics by Single Mother Poverty
Demographics Similar to Cherokee by Single Mother Poverty
In terms of single mother poverty, the demographic groups most similar to Cherokee are Dominican (34.5%, a difference of 0.11%), Hopi (34.5%, a difference of 0.22%), Chickasaw (34.4%, a difference of 0.30%), Immigrants from Dominican Republic (34.4%, a difference of 0.48%), and Immigrants from Honduras (34.7%, a difference of 0.52%).
| Demographics | Rating | Rank | Single Mother Poverty |
| Hondurans | 0.0 /100 | #310 | Tragic 34.2% |
| Alsatians | 0.0 /100 | #311 | Tragic 34.3% |
| Central American Indians | 0.0 /100 | #312 | Tragic 34.3% |
| Immigrants | Dominican Republic | 0.0 /100 | #313 | Tragic 34.4% |
| Chickasaw | 0.0 /100 | #314 | Tragic 34.4% |
| Hopi | 0.0 /100 | #315 | Tragic 34.5% |
| Dominicans | 0.0 /100 | #316 | Tragic 34.5% |
| Cherokee | 0.0 /100 | #317 | Tragic 34.5% |
| Immigrants | Honduras | 0.0 /100 | #318 | Tragic 34.7% |
| Chippewa | 0.0 /100 | #319 | Tragic 34.8% |
| Iroquois | 0.0 /100 | #320 | Tragic 34.8% |
| Paiute | 0.0 /100 | #321 | Tragic 35.1% |
| Blacks/African Americans | 0.0 /100 | #322 | Tragic 35.2% |
| Kiowa | 0.0 /100 | #323 | Tragic 35.5% |
| Ottawa | 0.0 /100 | #324 | Tragic 35.5% |
Demographics Similar to Blackfeet by Single Mother Poverty
In terms of single mother poverty, the demographic groups most similar to Blackfeet are Pennsylvania German (33.2%, a difference of 0.14%), Yaqui (33.1%, a difference of 0.16%), French American Indian (33.1%, a difference of 0.19%), African (33.3%, a difference of 0.25%), and Immigrants from Guatemala (33.3%, a difference of 0.34%).
| Demographics | Rating | Rank | Single Mother Poverty |
| U.S. Virgin Islanders | 0.0 /100 | #289 | Tragic 32.6% |
| Osage | 0.0 /100 | #290 | Tragic 32.6% |
| Guatemalans | 0.0 /100 | #291 | Tragic 32.9% |
| Shoshone | 0.0 /100 | #292 | Tragic 32.9% |
| Aleuts | 0.0 /100 | #293 | Tragic 32.9% |
| French American Indians | 0.0 /100 | #294 | Tragic 33.1% |
| Yaqui | 0.0 /100 | #295 | Tragic 33.1% |
| Blackfeet | 0.0 /100 | #296 | Tragic 33.2% |
| Pennsylvania Germans | 0.0 /100 | #297 | Tragic 33.2% |
| Africans | 0.0 /100 | #298 | Tragic 33.3% |
| Immigrants | Guatemala | 0.0 /100 | #299 | Tragic 33.3% |
| Hispanics or Latinos | 0.0 /100 | #300 | Tragic 33.3% |
| Immigrants | Somalia | 0.0 /100 | #301 | Tragic 33.4% |
| Arapaho | 0.0 /100 | #302 | Tragic 33.4% |
| Americans | 0.0 /100 | #303 | Tragic 33.5% |