Nepalese vs Blackfeet Single Mother Poverty
COMPARE
Nepalese
Blackfeet
Single Mother Poverty
Single Mother Poverty Comparison
Nepalese
Blackfeet
29.3%
SINGLE MOTHER POVERTY
38.3/ 100
METRIC RATING
183rd/ 347
METRIC RANK
33.2%
SINGLE MOTHER POVERTY
0.0/ 100
METRIC RATING
296th/ 347
METRIC RANK
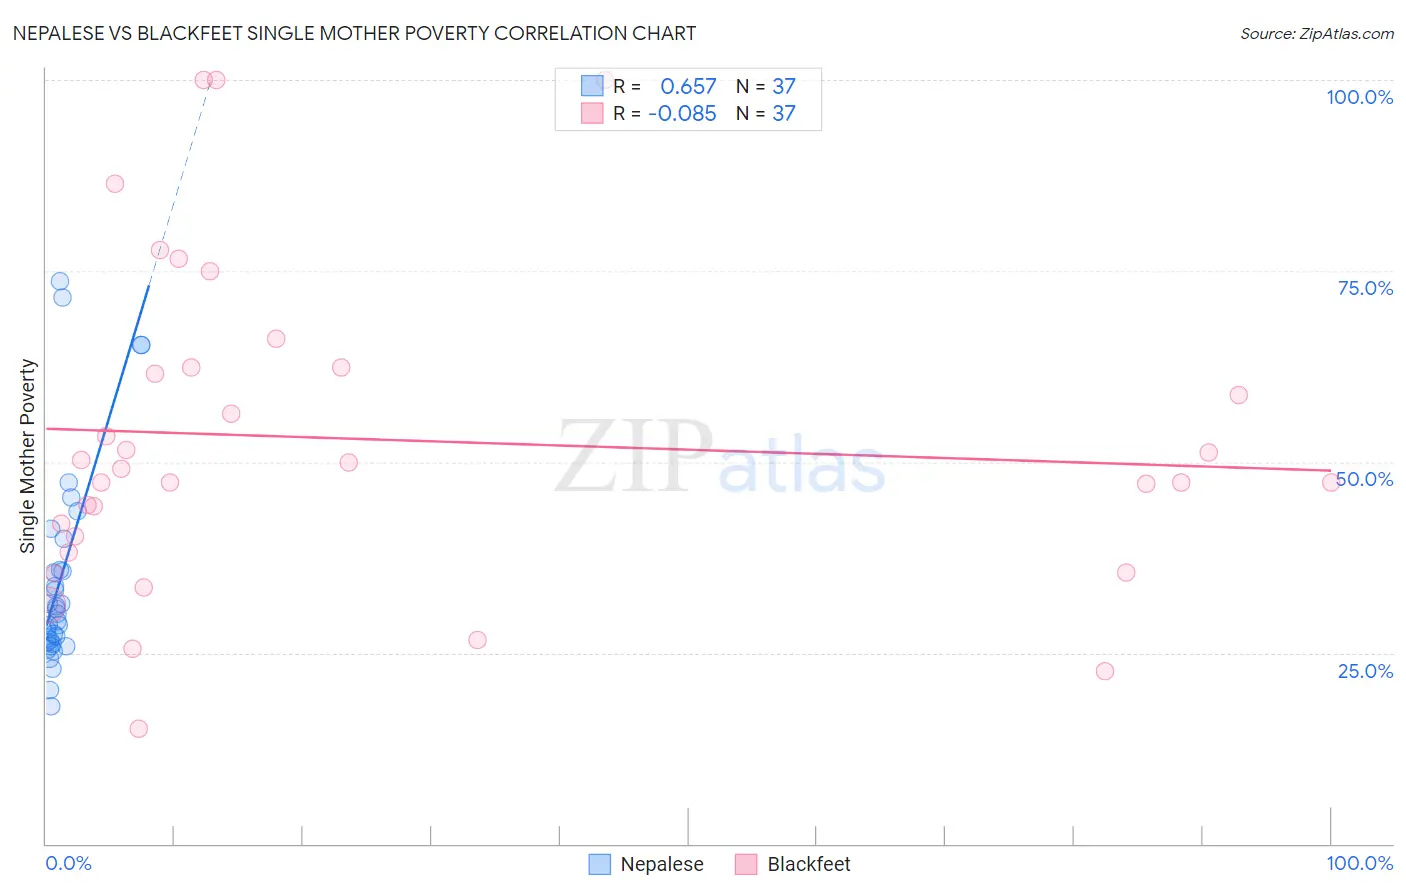
Nepalese vs Blackfeet Single Mother Poverty Correlation Chart
The statistical analysis conducted on geographies consisting of 24,439,991 people shows a significant positive correlation between the proportion of Nepalese and poverty level among single mothers in the United States with a correlation coefficient (R) of 0.657 and weighted average of 29.3%. Similarly, the statistical analysis conducted on geographies consisting of 305,769,036 people shows a slight negative correlation between the proportion of Blackfeet and poverty level among single mothers in the United States with a correlation coefficient (R) of -0.085 and weighted average of 33.2%, a difference of 13.2%.
Single Mother Poverty Correlation Summary
| Measurement | Nepalese | Blackfeet |
| Minimum | 17.9% | 15.0% |
| Maximum | 73.6% | 100.0% |
| Range | 55.7% | 85.0% |
| Mean | 34.7% | 53.0% |
| Median | 30.1% | 49.2% |
| Interquartile 25% (IQ1) | 26.3% | 39.3% |
| Interquartile 75% (IQ3) | 37.9% | 62.4% |
| Interquartile Range (IQR) | 11.7% | 23.1% |
| Standard Deviation (Sample) | 13.8% | 21.1% |
| Standard Deviation (Population) | 13.6% | 20.8% |
Similar Demographics by Single Mother Poverty
Demographics Similar to Nepalese by Single Mother Poverty
In terms of single mother poverty, the demographic groups most similar to Nepalese are Immigrants from Eastern Africa (29.3%, a difference of 0.010%), Nigerian (29.3%, a difference of 0.010%), Ghanaian (29.4%, a difference of 0.070%), Canadian (29.3%, a difference of 0.11%), and Yugoslavian (29.4%, a difference of 0.11%).
| Demographics | Rating | Rank | Single Mother Poverty |
| Hawaiians | 47.8 /100 | #176 | Average 29.2% |
| Immigrants | Bosnia and Herzegovina | 45.1 /100 | #177 | Average 29.2% |
| South American Indians | 43.2 /100 | #178 | Average 29.3% |
| Immigrants | Uzbekistan | 42.6 /100 | #179 | Average 29.3% |
| Immigrants | Norway | 41.5 /100 | #180 | Average 29.3% |
| Canadians | 40.4 /100 | #181 | Average 29.3% |
| Immigrants | Eastern Africa | 38.5 /100 | #182 | Fair 29.3% |
| Nepalese | 38.3 /100 | #183 | Fair 29.3% |
| Nigerians | 38.0 /100 | #184 | Fair 29.3% |
| Ghanaians | 36.8 /100 | #185 | Fair 29.4% |
| Yugoslavians | 36.0 /100 | #186 | Fair 29.4% |
| Lebanese | 32.5 /100 | #187 | Fair 29.4% |
| Guamanians/Chamorros | 31.8 /100 | #188 | Fair 29.4% |
| Immigrants | Africa | 31.6 /100 | #189 | Fair 29.4% |
| Immigrants | Germany | 30.4 /100 | #190 | Fair 29.5% |
Demographics Similar to Blackfeet by Single Mother Poverty
In terms of single mother poverty, the demographic groups most similar to Blackfeet are Pennsylvania German (33.2%, a difference of 0.14%), Yaqui (33.1%, a difference of 0.16%), French American Indian (33.1%, a difference of 0.19%), African (33.3%, a difference of 0.25%), and Immigrants from Guatemala (33.3%, a difference of 0.34%).
| Demographics | Rating | Rank | Single Mother Poverty |
| U.S. Virgin Islanders | 0.0 /100 | #289 | Tragic 32.6% |
| Osage | 0.0 /100 | #290 | Tragic 32.6% |
| Guatemalans | 0.0 /100 | #291 | Tragic 32.9% |
| Shoshone | 0.0 /100 | #292 | Tragic 32.9% |
| Aleuts | 0.0 /100 | #293 | Tragic 32.9% |
| French American Indians | 0.0 /100 | #294 | Tragic 33.1% |
| Yaqui | 0.0 /100 | #295 | Tragic 33.1% |
| Blackfeet | 0.0 /100 | #296 | Tragic 33.2% |
| Pennsylvania Germans | 0.0 /100 | #297 | Tragic 33.2% |
| Africans | 0.0 /100 | #298 | Tragic 33.3% |
| Immigrants | Guatemala | 0.0 /100 | #299 | Tragic 33.3% |
| Hispanics or Latinos | 0.0 /100 | #300 | Tragic 33.3% |
| Immigrants | Somalia | 0.0 /100 | #301 | Tragic 33.4% |
| Arapaho | 0.0 /100 | #302 | Tragic 33.4% |
| Americans | 0.0 /100 | #303 | Tragic 33.5% |