Chinese vs Blackfeet Single Mother Poverty
COMPARE
Chinese
Blackfeet
Single Mother Poverty
Single Mother Poverty Comparison
Chinese
Blackfeet
24.6%
SINGLE MOTHER POVERTY
100.0/ 100
METRIC RATING
7th/ 347
METRIC RANK
33.2%
SINGLE MOTHER POVERTY
0.0/ 100
METRIC RATING
296th/ 347
METRIC RANK
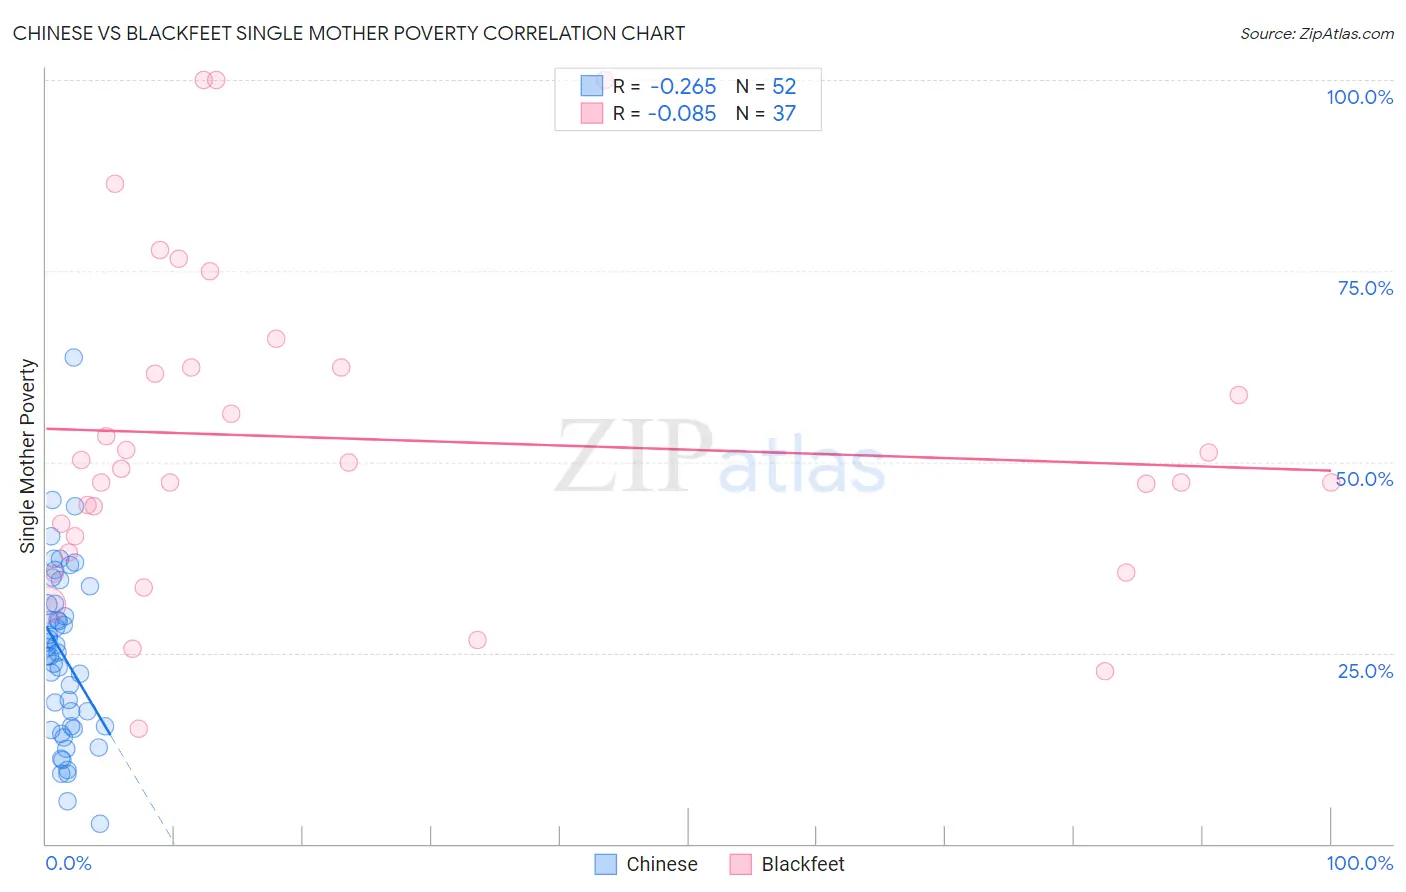
Chinese vs Blackfeet Single Mother Poverty Correlation Chart
The statistical analysis conducted on geographies consisting of 64,411,570 people shows a weak negative correlation between the proportion of Chinese and poverty level among single mothers in the United States with a correlation coefficient (R) of -0.265 and weighted average of 24.6%. Similarly, the statistical analysis conducted on geographies consisting of 305,769,036 people shows a slight negative correlation between the proportion of Blackfeet and poverty level among single mothers in the United States with a correlation coefficient (R) of -0.085 and weighted average of 33.2%, a difference of 34.8%.
Single Mother Poverty Correlation Summary
| Measurement | Chinese | Blackfeet |
| Minimum | 2.6% | 15.0% |
| Maximum | 63.6% | 100.0% |
| Range | 61.1% | 85.0% |
| Mean | 24.6% | 53.0% |
| Median | 24.8% | 49.2% |
| Interquartile 25% (IQ1) | 15.2% | 39.3% |
| Interquartile 75% (IQ3) | 31.4% | 62.4% |
| Interquartile Range (IQR) | 16.2% | 23.1% |
| Standard Deviation (Sample) | 11.6% | 21.1% |
| Standard Deviation (Population) | 11.4% | 20.8% |
Similar Demographics by Single Mother Poverty
Demographics Similar to Chinese by Single Mother Poverty
In terms of single mother poverty, the demographic groups most similar to Chinese are Thai (24.5%, a difference of 0.54%), Immigrants from Hong Kong (24.4%, a difference of 1.0%), Filipino (24.3%, a difference of 1.3%), Immigrants from Iran (25.1%, a difference of 2.0%), and Immigrants from Lithuania (25.2%, a difference of 2.4%).
| Demographics | Rating | Rank | Single Mother Poverty |
| Assyrians/Chaldeans/Syriacs | 100.0 /100 | #1 | Exceptional 23.8% |
| Immigrants | India | 100.0 /100 | #2 | Exceptional 23.8% |
| Immigrants | Taiwan | 100.0 /100 | #3 | Exceptional 23.9% |
| Filipinos | 100.0 /100 | #4 | Exceptional 24.3% |
| Immigrants | Hong Kong | 100.0 /100 | #5 | Exceptional 24.4% |
| Thais | 100.0 /100 | #6 | Exceptional 24.5% |
| Chinese | 100.0 /100 | #7 | Exceptional 24.6% |
| Immigrants | Iran | 100.0 /100 | #8 | Exceptional 25.1% |
| Immigrants | Lithuania | 100.0 /100 | #9 | Exceptional 25.2% |
| Immigrants | South Central Asia | 100.0 /100 | #10 | Exceptional 25.3% |
| Iranians | 100.0 /100 | #11 | Exceptional 25.5% |
| Bhutanese | 100.0 /100 | #12 | Exceptional 25.6% |
| Indians (Asian) | 100.0 /100 | #13 | Exceptional 25.8% |
| Immigrants | Singapore | 100.0 /100 | #14 | Exceptional 25.8% |
| Immigrants | Ireland | 100.0 /100 | #15 | Exceptional 25.8% |
Demographics Similar to Blackfeet by Single Mother Poverty
In terms of single mother poverty, the demographic groups most similar to Blackfeet are Pennsylvania German (33.2%, a difference of 0.14%), Yaqui (33.1%, a difference of 0.16%), French American Indian (33.1%, a difference of 0.19%), African (33.3%, a difference of 0.25%), and Immigrants from Guatemala (33.3%, a difference of 0.34%).
| Demographics | Rating | Rank | Single Mother Poverty |
| U.S. Virgin Islanders | 0.0 /100 | #289 | Tragic 32.6% |
| Osage | 0.0 /100 | #290 | Tragic 32.6% |
| Guatemalans | 0.0 /100 | #291 | Tragic 32.9% |
| Shoshone | 0.0 /100 | #292 | Tragic 32.9% |
| Aleuts | 0.0 /100 | #293 | Tragic 32.9% |
| French American Indians | 0.0 /100 | #294 | Tragic 33.1% |
| Yaqui | 0.0 /100 | #295 | Tragic 33.1% |
| Blackfeet | 0.0 /100 | #296 | Tragic 33.2% |
| Pennsylvania Germans | 0.0 /100 | #297 | Tragic 33.2% |
| Africans | 0.0 /100 | #298 | Tragic 33.3% |
| Immigrants | Guatemala | 0.0 /100 | #299 | Tragic 33.3% |
| Hispanics or Latinos | 0.0 /100 | #300 | Tragic 33.3% |
| Immigrants | Somalia | 0.0 /100 | #301 | Tragic 33.4% |
| Arapaho | 0.0 /100 | #302 | Tragic 33.4% |
| Americans | 0.0 /100 | #303 | Tragic 33.5% |