Blackfeet vs Australian Single Mother Poverty
COMPARE
Blackfeet
Australian
Single Mother Poverty
Single Mother Poverty Comparison
Blackfeet
Australians
33.2%
SINGLE MOTHER POVERTY
0.0/ 100
METRIC RATING
296th/ 347
METRIC RANK
28.3%
SINGLE MOTHER POVERTY
92.5/ 100
METRIC RATING
117th/ 347
METRIC RANK
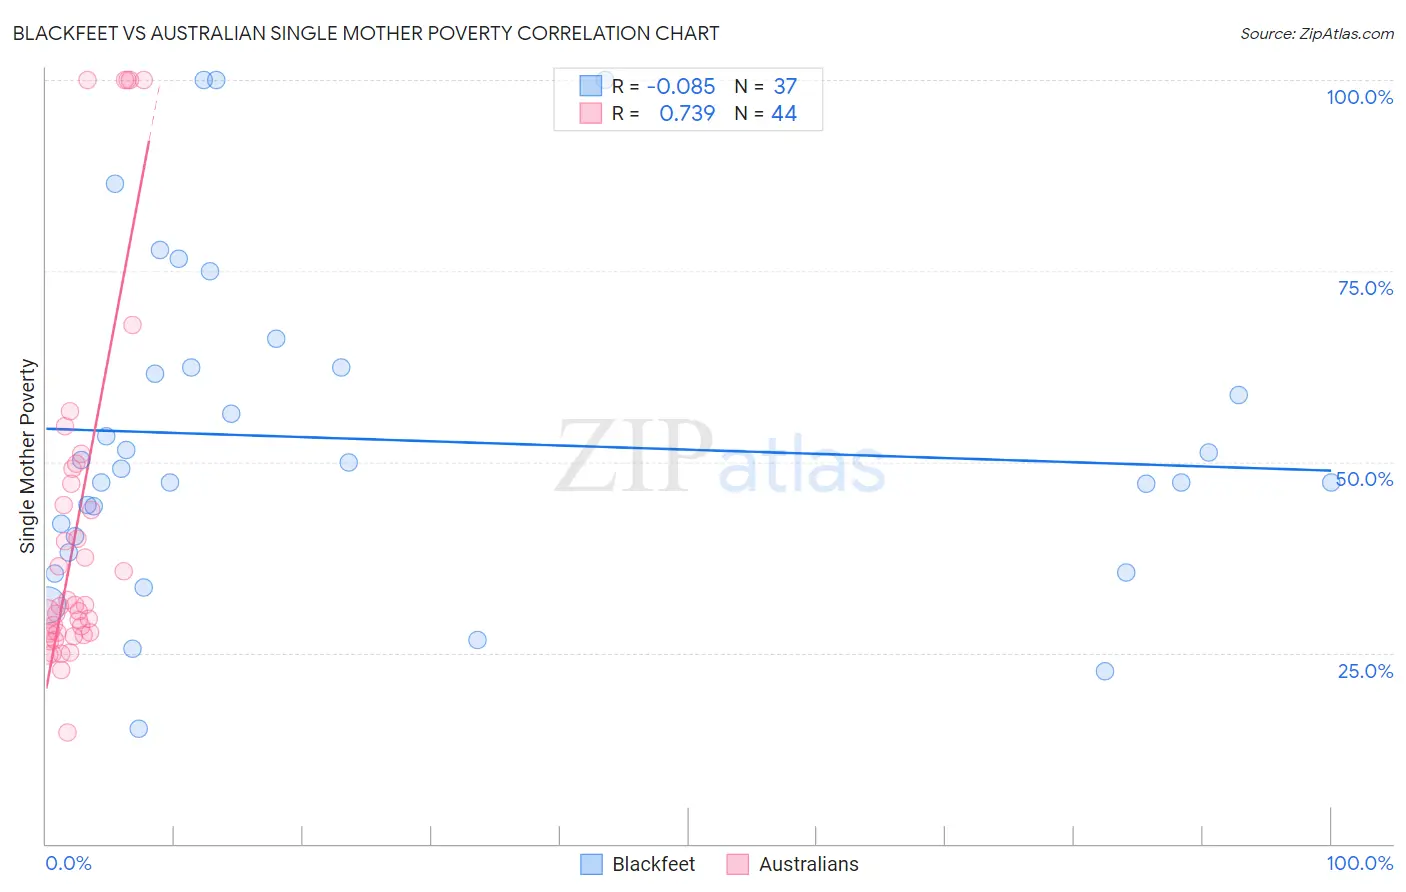
Blackfeet vs Australian Single Mother Poverty Correlation Chart
The statistical analysis conducted on geographies consisting of 305,769,036 people shows a slight negative correlation between the proportion of Blackfeet and poverty level among single mothers in the United States with a correlation coefficient (R) of -0.085 and weighted average of 33.2%. Similarly, the statistical analysis conducted on geographies consisting of 220,322,695 people shows a strong positive correlation between the proportion of Australians and poverty level among single mothers in the United States with a correlation coefficient (R) of 0.739 and weighted average of 28.3%, a difference of 17.3%.
Single Mother Poverty Correlation Summary
| Measurement | Blackfeet | Australian |
| Minimum | 15.0% | 14.5% |
| Maximum | 100.0% | 100.0% |
| Range | 85.0% | 85.5% |
| Mean | 53.0% | 41.8% |
| Median | 49.2% | 31.2% |
| Interquartile 25% (IQ1) | 39.3% | 27.6% |
| Interquartile 75% (IQ3) | 62.4% | 48.1% |
| Interquartile Range (IQR) | 23.1% | 20.5% |
| Standard Deviation (Sample) | 21.1% | 23.5% |
| Standard Deviation (Population) | 20.8% | 23.2% |
Similar Demographics by Single Mother Poverty
Demographics Similar to Blackfeet by Single Mother Poverty
In terms of single mother poverty, the demographic groups most similar to Blackfeet are Pennsylvania German (33.2%, a difference of 0.14%), Yaqui (33.1%, a difference of 0.16%), French American Indian (33.1%, a difference of 0.19%), African (33.3%, a difference of 0.25%), and Immigrants from Guatemala (33.3%, a difference of 0.34%).
| Demographics | Rating | Rank | Single Mother Poverty |
| U.S. Virgin Islanders | 0.0 /100 | #289 | Tragic 32.6% |
| Osage | 0.0 /100 | #290 | Tragic 32.6% |
| Guatemalans | 0.0 /100 | #291 | Tragic 32.9% |
| Shoshone | 0.0 /100 | #292 | Tragic 32.9% |
| Aleuts | 0.0 /100 | #293 | Tragic 32.9% |
| French American Indians | 0.0 /100 | #294 | Tragic 33.1% |
| Yaqui | 0.0 /100 | #295 | Tragic 33.1% |
| Blackfeet | 0.0 /100 | #296 | Tragic 33.2% |
| Pennsylvania Germans | 0.0 /100 | #297 | Tragic 33.2% |
| Africans | 0.0 /100 | #298 | Tragic 33.3% |
| Immigrants | Guatemala | 0.0 /100 | #299 | Tragic 33.3% |
| Hispanics or Latinos | 0.0 /100 | #300 | Tragic 33.3% |
| Immigrants | Somalia | 0.0 /100 | #301 | Tragic 33.4% |
| Arapaho | 0.0 /100 | #302 | Tragic 33.4% |
| Americans | 0.0 /100 | #303 | Tragic 33.5% |
Demographics Similar to Australians by Single Mother Poverty
In terms of single mother poverty, the demographic groups most similar to Australians are Immigrants from Uganda (28.3%, a difference of 0.010%), Brazilian (28.3%, a difference of 0.010%), Immigrants from Syria (28.3%, a difference of 0.020%), Immigrants from Kuwait (28.3%, a difference of 0.030%), and Immigrants from Western Asia (28.3%, a difference of 0.040%).
| Demographics | Rating | Rank | Single Mother Poverty |
| Croatians | 94.8 /100 | #110 | Exceptional 28.2% |
| Venezuelans | 94.5 /100 | #111 | Exceptional 28.2% |
| Immigrants | Kazakhstan | 94.5 /100 | #112 | Exceptional 28.2% |
| Immigrants | South Africa | 93.2 /100 | #113 | Exceptional 28.3% |
| Immigrants | Western Asia | 92.7 /100 | #114 | Exceptional 28.3% |
| Immigrants | Kuwait | 92.7 /100 | #115 | Exceptional 28.3% |
| Immigrants | Uganda | 92.5 /100 | #116 | Exceptional 28.3% |
| Australians | 92.5 /100 | #117 | Exceptional 28.3% |
| Brazilians | 92.4 /100 | #118 | Exceptional 28.3% |
| Immigrants | Syria | 92.4 /100 | #119 | Exceptional 28.3% |
| Cypriots | 92.3 /100 | #120 | Exceptional 28.3% |
| Immigrants | Afghanistan | 92.1 /100 | #121 | Exceptional 28.3% |
| Colombians | 91.8 /100 | #122 | Exceptional 28.3% |
| Uruguayans | 91.7 /100 | #123 | Exceptional 28.3% |
| Immigrants | Switzerland | 91.7 /100 | #124 | Exceptional 28.3% |