Marshallese vs Immigrants from Panama Single Male Poverty
COMPARE
Marshallese
Immigrants from Panama
Single Male Poverty
Single Male Poverty Comparison
Marshallese
Immigrants from Panama
16.4%
SINGLE MALE POVERTY
0.0/ 100
METRIC RATING
320th/ 347
METRIC RANK
12.6%
SINGLE MALE POVERTY
72.1/ 100
METRIC RATING
150th/ 347
METRIC RANK
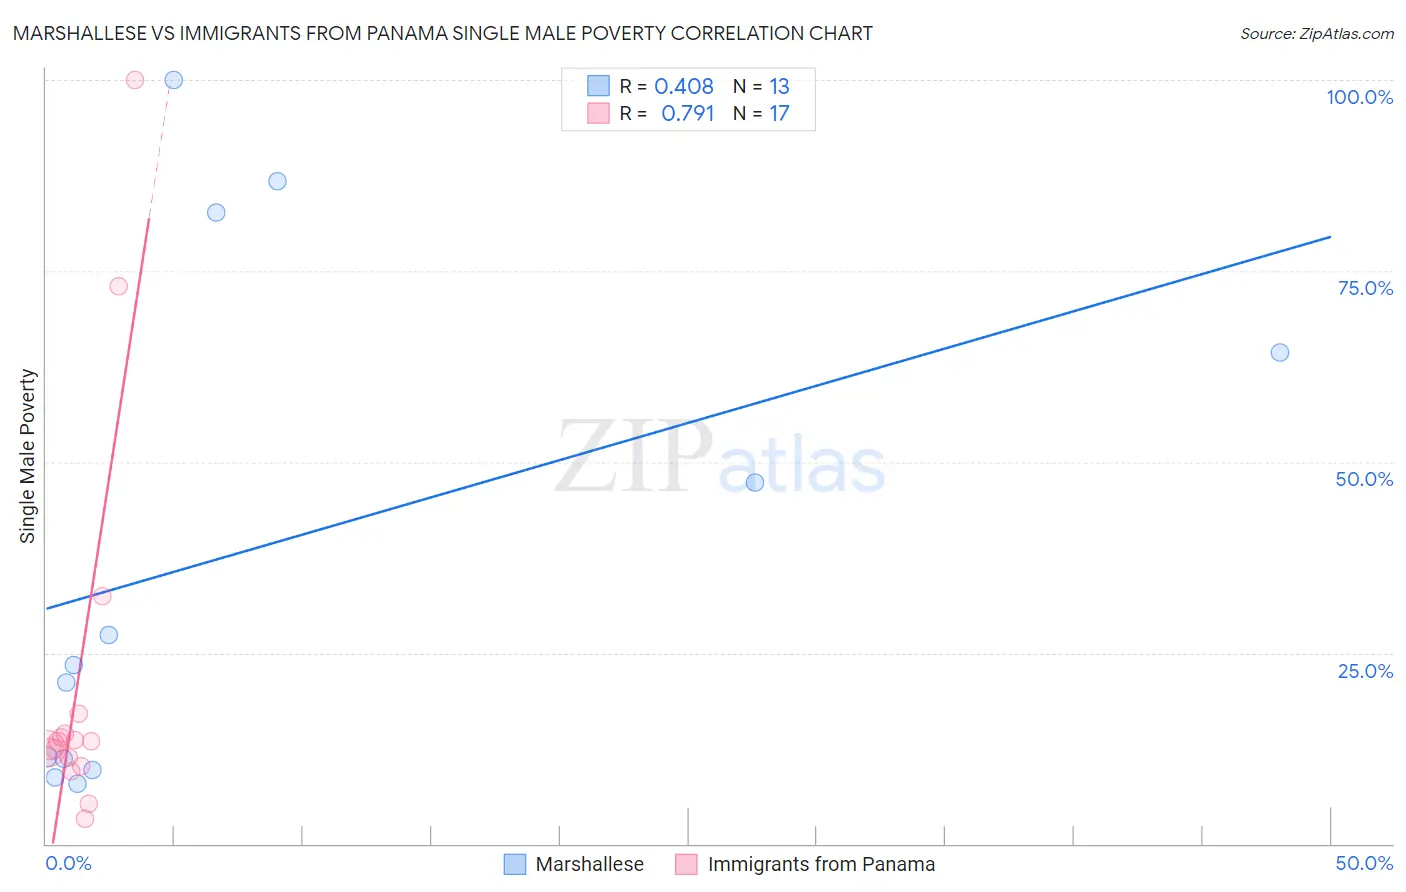
Marshallese vs Immigrants from Panama Single Male Poverty Correlation Chart
The statistical analysis conducted on geographies consisting of 14,469,521 people shows a moderate positive correlation between the proportion of Marshallese and poverty level among single males in the United States with a correlation coefficient (R) of 0.408 and weighted average of 16.4%. Similarly, the statistical analysis conducted on geographies consisting of 206,693,503 people shows a strong positive correlation between the proportion of Immigrants from Panama and poverty level among single males in the United States with a correlation coefficient (R) of 0.791 and weighted average of 12.6%, a difference of 30.1%.
Single Male Poverty Correlation Summary
| Measurement | Marshallese | Immigrants from Panama |
| Minimum | 7.9% | 3.3% |
| Maximum | 100.0% | 100.0% |
| Range | 92.1% | 96.7% |
| Mean | 38.6% | 21.6% |
| Median | 23.3% | 13.3% |
| Interquartile 25% (IQ1) | 10.4% | 10.7% |
| Interquartile 75% (IQ3) | 73.5% | 15.6% |
| Interquartile Range (IQR) | 63.1% | 4.9% |
| Standard Deviation (Sample) | 33.7% | 25.6% |
| Standard Deviation (Population) | 32.3% | 24.8% |
Similar Demographics by Single Male Poverty
Demographics Similar to Marshallese by Single Male Poverty
In terms of single male poverty, the demographic groups most similar to Marshallese are Osage (16.5%, a difference of 0.13%), Chippewa (16.4%, a difference of 0.48%), Chickasaw (16.3%, a difference of 0.78%), Shoshone (16.7%, a difference of 1.4%), and Black/African American (16.2%, a difference of 1.6%).
| Demographics | Rating | Rank | Single Male Poverty |
| Cherokee | 0.0 /100 | #313 | Tragic 16.1% |
| Alaskan Athabascans | 0.0 /100 | #314 | Tragic 16.1% |
| Cheyenne | 0.0 /100 | #315 | Tragic 16.1% |
| Dutch West Indians | 0.0 /100 | #316 | Tragic 16.1% |
| Blacks/African Americans | 0.0 /100 | #317 | Tragic 16.2% |
| Chickasaw | 0.0 /100 | #318 | Tragic 16.3% |
| Chippewa | 0.0 /100 | #319 | Tragic 16.4% |
| Marshallese | 0.0 /100 | #320 | Tragic 16.4% |
| Osage | 0.0 /100 | #321 | Tragic 16.5% |
| Shoshone | 0.0 /100 | #322 | Tragic 16.7% |
| Creek | 0.0 /100 | #323 | Tragic 16.8% |
| Immigrants | Yemen | 0.0 /100 | #324 | Tragic 16.9% |
| Choctaw | 0.0 /100 | #325 | Tragic 17.0% |
| Central American Indians | 0.0 /100 | #326 | Tragic 17.2% |
| Menominee | 0.0 /100 | #327 | Tragic 17.7% |
Demographics Similar to Immigrants from Panama by Single Male Poverty
In terms of single male poverty, the demographic groups most similar to Immigrants from Panama are Immigrants from Hungary (12.6%, a difference of 0.010%), Australian (12.6%, a difference of 0.050%), Sierra Leonean (12.6%, a difference of 0.060%), Yugoslavian (12.6%, a difference of 0.13%), and Immigrants (12.7%, a difference of 0.13%).
| Demographics | Rating | Rank | Single Male Poverty |
| Immigrants | France | 75.8 /100 | #143 | Good 12.6% |
| Hawaiians | 75.1 /100 | #144 | Good 12.6% |
| Immigrants | Lebanon | 75.0 /100 | #145 | Good 12.6% |
| Native Hawaiians | 75.0 /100 | #146 | Good 12.6% |
| Malaysians | 74.8 /100 | #147 | Good 12.6% |
| Yugoslavians | 73.9 /100 | #148 | Good 12.6% |
| Sierra Leoneans | 73.0 /100 | #149 | Good 12.6% |
| Immigrants | Panama | 72.1 /100 | #150 | Good 12.6% |
| Immigrants | Hungary | 71.9 /100 | #151 | Good 12.6% |
| Australians | 71.4 /100 | #152 | Good 12.6% |
| Immigrants | Immigrants | 70.1 /100 | #153 | Good 12.7% |
| Immigrants | Scotland | 68.9 /100 | #154 | Good 12.7% |
| Immigrants | Spain | 68.7 /100 | #155 | Good 12.7% |
| Vietnamese | 67.9 /100 | #156 | Good 12.7% |
| Latvians | 67.9 /100 | #157 | Good 12.7% |