Marshallese vs Immigrants from Panama In Labor Force | Age 20-64
COMPARE
Marshallese
Immigrants from Panama
In Labor Force | Age 20-64
In Labor Force | Age 20-64 Comparison
Marshallese
Immigrants from Panama
78.3%
IN LABOR FORCE | AGE 20-64
0.0/ 100
METRIC RATING
272nd/ 347
METRIC RANK
79.1%
IN LABOR FORCE | AGE 20-64
6.9/ 100
METRIC RATING
222nd/ 347
METRIC RANK
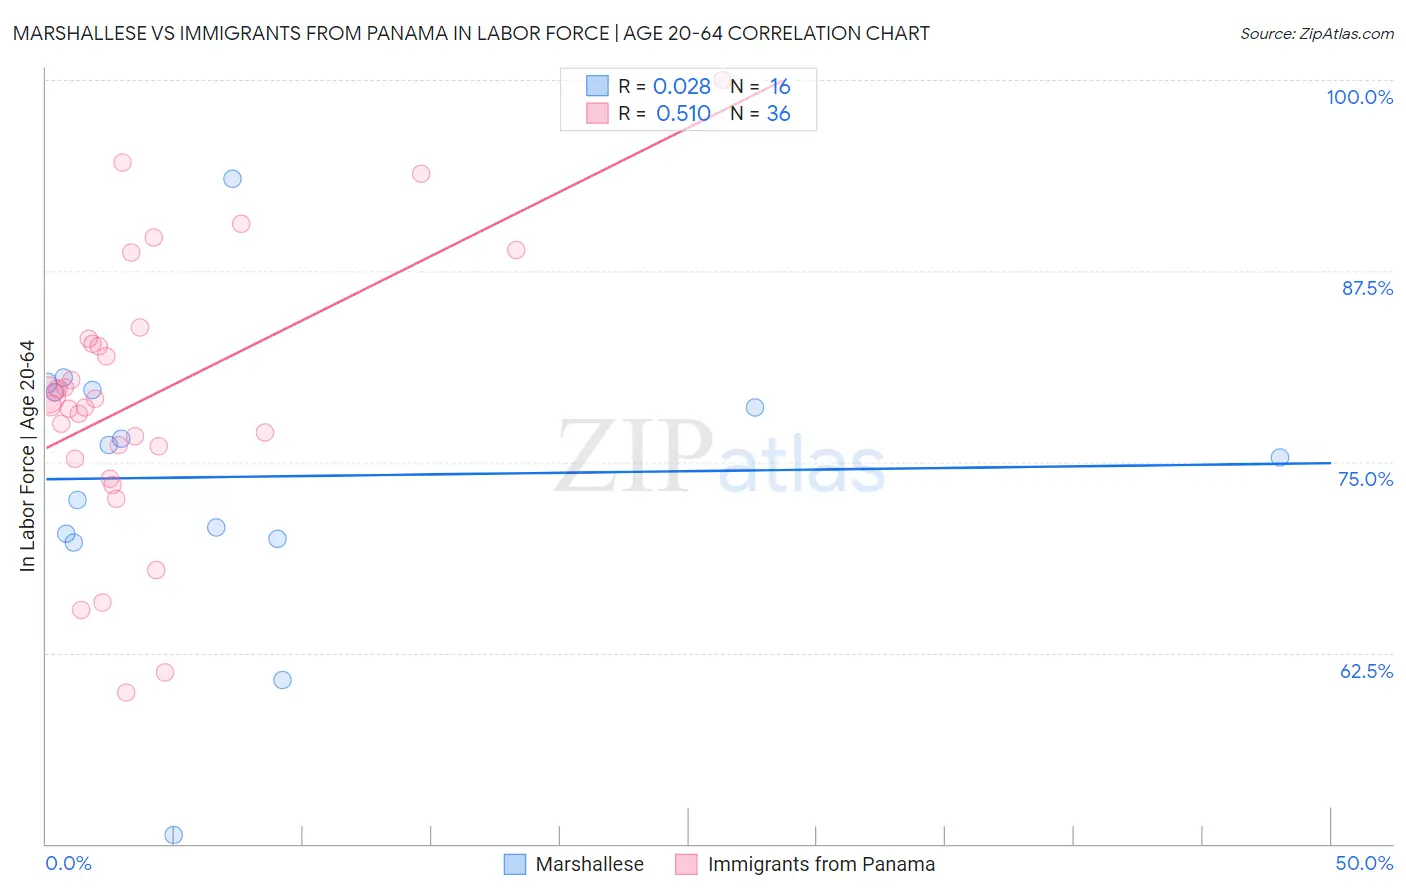
Marshallese vs Immigrants from Panama In Labor Force | Age 20-64 Correlation Chart
The statistical analysis conducted on geographies consisting of 14,761,315 people shows no correlation between the proportion of Marshallese and labor force participation rate among population between the ages 20 and 64 in the United States with a correlation coefficient (R) of 0.028 and weighted average of 78.3%. Similarly, the statistical analysis conducted on geographies consisting of 221,185,422 people shows a substantial positive correlation between the proportion of Immigrants from Panama and labor force participation rate among population between the ages 20 and 64 in the United States with a correlation coefficient (R) of 0.510 and weighted average of 79.1%, a difference of 1.1%.
In Labor Force | Age 20-64 Correlation Summary
| Measurement | Marshallese | Immigrants from Panama |
| Minimum | 50.6% | 59.9% |
| Maximum | 93.5% | 100.0% |
| Range | 42.9% | 40.1% |
| Mean | 74.0% | 79.2% |
| Median | 75.7% | 78.9% |
| Interquartile 25% (IQ1) | 70.1% | 75.6% |
| Interquartile 75% (IQ3) | 79.6% | 82.9% |
| Interquartile Range (IQR) | 9.5% | 7.3% |
| Standard Deviation (Sample) | 9.5% | 8.8% |
| Standard Deviation (Population) | 9.2% | 8.7% |
Similar Demographics by In Labor Force | Age 20-64
Demographics Similar to Marshallese by In Labor Force | Age 20-64
In terms of in labor force | age 20-64, the demographic groups most similar to Marshallese are Immigrants from Latin America (78.3%, a difference of 0.0%), Scotch-Irish (78.3%, a difference of 0.020%), Immigrants from Barbados (78.3%, a difference of 0.040%), French American Indian (78.2%, a difference of 0.040%), and Aleut (78.2%, a difference of 0.070%).
| Demographics | Rating | Rank | In Labor Force | Age 20-64 |
| British West Indians | 0.1 /100 | #265 | Tragic 78.4% |
| Bahamians | 0.1 /100 | #266 | Tragic 78.4% |
| U.S. Virgin Islanders | 0.1 /100 | #267 | Tragic 78.4% |
| West Indians | 0.0 /100 | #268 | Tragic 78.3% |
| Immigrants | Barbados | 0.0 /100 | #269 | Tragic 78.3% |
| Scotch-Irish | 0.0 /100 | #270 | Tragic 78.3% |
| Immigrants | Latin America | 0.0 /100 | #271 | Tragic 78.3% |
| Marshallese | 0.0 /100 | #272 | Tragic 78.3% |
| French American Indians | 0.0 /100 | #273 | Tragic 78.2% |
| Aleuts | 0.0 /100 | #274 | Tragic 78.2% |
| Spanish | 0.0 /100 | #275 | Tragic 78.2% |
| Puget Sound Salish | 0.0 /100 | #276 | Tragic 78.2% |
| Immigrants | Bahamas | 0.0 /100 | #277 | Tragic 78.2% |
| Mexican American Indians | 0.0 /100 | #278 | Tragic 78.2% |
| Belizeans | 0.0 /100 | #279 | Tragic 78.2% |
Demographics Similar to Immigrants from Panama by In Labor Force | Age 20-64
In terms of in labor force | age 20-64, the demographic groups most similar to Immigrants from Panama are Canadian (79.1%, a difference of 0.0%), Immigrants from Uzbekistan (79.1%, a difference of 0.0%), Hungarian (79.2%, a difference of 0.010%), Portuguese (79.1%, a difference of 0.020%), and Immigrants (79.2%, a difference of 0.030%).
| Demographics | Rating | Rank | In Labor Force | Age 20-64 |
| Immigrants | Norway | 12.0 /100 | #215 | Poor 79.2% |
| Arabs | 11.4 /100 | #216 | Poor 79.2% |
| Immigrants | Western Asia | 11.0 /100 | #217 | Poor 79.2% |
| Immigrants | England | 9.3 /100 | #218 | Tragic 79.2% |
| French Canadians | 8.4 /100 | #219 | Tragic 79.2% |
| Immigrants | Immigrants | 7.7 /100 | #220 | Tragic 79.2% |
| Hungarians | 7.2 /100 | #221 | Tragic 79.2% |
| Immigrants | Panama | 6.9 /100 | #222 | Tragic 79.1% |
| Canadians | 6.8 /100 | #223 | Tragic 79.1% |
| Immigrants | Uzbekistan | 6.8 /100 | #224 | Tragic 79.1% |
| Portuguese | 6.4 /100 | #225 | Tragic 79.1% |
| Central Americans | 5.9 /100 | #226 | Tragic 79.1% |
| Immigrants | Western Europe | 5.9 /100 | #227 | Tragic 79.1% |
| Panamanians | 5.7 /100 | #228 | Tragic 79.1% |
| Alsatians | 5.7 /100 | #229 | Tragic 79.1% |