Immigrants from Liberia vs Immigrants from Panama Single Male Poverty
COMPARE
Immigrants from Liberia
Immigrants from Panama
Single Male Poverty
Single Male Poverty Comparison
Immigrants from Liberia
Immigrants from Panama
12.7%
SINGLE MALE POVERTY
64.2/ 100
METRIC RATING
159th/ 347
METRIC RANK
12.6%
SINGLE MALE POVERTY
72.1/ 100
METRIC RATING
150th/ 347
METRIC RANK
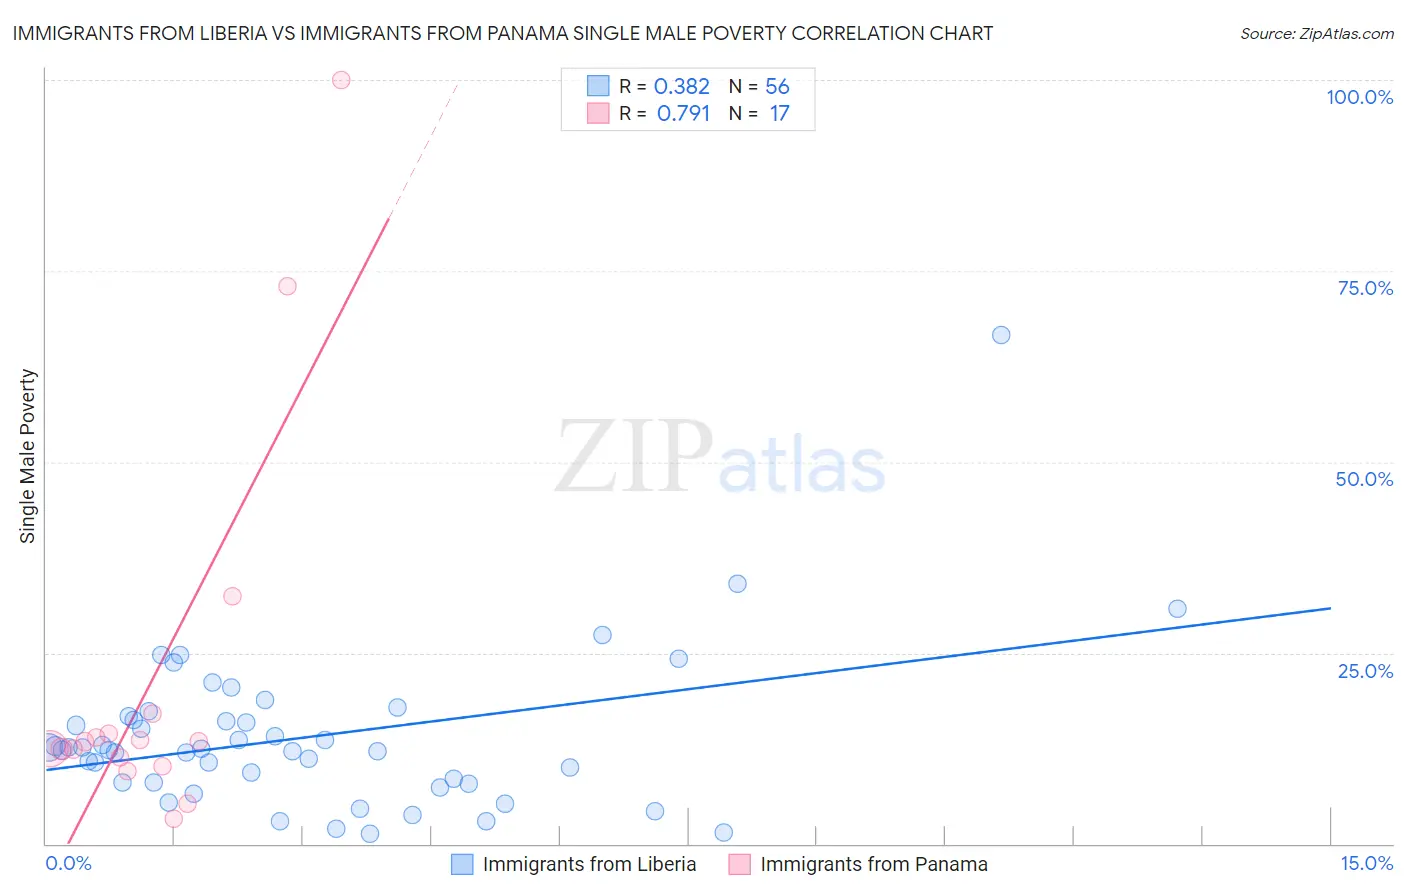
Immigrants from Liberia vs Immigrants from Panama Single Male Poverty Correlation Chart
The statistical analysis conducted on geographies consisting of 128,507,837 people shows a mild positive correlation between the proportion of Immigrants from Liberia and poverty level among single males in the United States with a correlation coefficient (R) of 0.382 and weighted average of 12.7%. Similarly, the statistical analysis conducted on geographies consisting of 206,693,503 people shows a strong positive correlation between the proportion of Immigrants from Panama and poverty level among single males in the United States with a correlation coefficient (R) of 0.791 and weighted average of 12.6%, a difference of 0.49%.
Single Male Poverty Correlation Summary
| Measurement | Immigrants from Liberia | Immigrants from Panama |
| Minimum | 1.3% | 3.3% |
| Maximum | 66.7% | 100.0% |
| Range | 65.4% | 96.7% |
| Mean | 13.9% | 21.6% |
| Median | 12.4% | 13.3% |
| Interquartile 25% (IQ1) | 8.0% | 10.7% |
| Interquartile 75% (IQ3) | 16.4% | 15.6% |
| Interquartile Range (IQR) | 8.3% | 4.9% |
| Standard Deviation (Sample) | 10.2% | 25.6% |
| Standard Deviation (Population) | 10.1% | 24.8% |
Demographics Similar to Immigrants from Liberia and Immigrants from Panama by Single Male Poverty
In terms of single male poverty, the demographic groups most similar to Immigrants from Liberia are Greek (12.7%, a difference of 0.0%), Immigrants from Middle Africa (12.7%, a difference of 0.040%), Immigrants from Africa (12.7%, a difference of 0.040%), Eastern European (12.7%, a difference of 0.050%), and Palestinian (12.7%, a difference of 0.060%). Similarly, the demographic groups most similar to Immigrants from Panama are Immigrants from Hungary (12.6%, a difference of 0.010%), Australian (12.6%, a difference of 0.050%), Sierra Leonean (12.6%, a difference of 0.060%), Yugoslavian (12.6%, a difference of 0.13%), and Immigrants (12.7%, a difference of 0.13%).
| Demographics | Rating | Rank | Single Male Poverty |
| Hawaiians | 75.1 /100 | #144 | Good 12.6% |
| Immigrants | Lebanon | 75.0 /100 | #145 | Good 12.6% |
| Native Hawaiians | 75.0 /100 | #146 | Good 12.6% |
| Malaysians | 74.8 /100 | #147 | Good 12.6% |
| Yugoslavians | 73.9 /100 | #148 | Good 12.6% |
| Sierra Leoneans | 73.0 /100 | #149 | Good 12.6% |
| Immigrants | Panama | 72.1 /100 | #150 | Good 12.6% |
| Immigrants | Hungary | 71.9 /100 | #151 | Good 12.6% |
| Australians | 71.4 /100 | #152 | Good 12.6% |
| Immigrants | Immigrants | 70.1 /100 | #153 | Good 12.7% |
| Immigrants | Scotland | 68.9 /100 | #154 | Good 12.7% |
| Immigrants | Spain | 68.7 /100 | #155 | Good 12.7% |
| Vietnamese | 67.9 /100 | #156 | Good 12.7% |
| Latvians | 67.9 /100 | #157 | Good 12.7% |
| Immigrants | Middle Africa | 64.9 /100 | #158 | Good 12.7% |
| Immigrants | Liberia | 64.2 /100 | #159 | Good 12.7% |
| Greeks | 64.1 /100 | #160 | Good 12.7% |
| Immigrants | Africa | 63.4 /100 | #161 | Good 12.7% |
| Eastern Europeans | 63.3 /100 | #162 | Good 12.7% |
| Palestinians | 63.1 /100 | #163 | Good 12.7% |
| Immigrants | Nigeria | 62.8 /100 | #164 | Good 12.7% |