Maltese vs Immigrants from Sweden 10th Grade
COMPARE
Maltese
Immigrants from Sweden
10th Grade
10th Grade Comparison
Maltese
Immigrants from Sweden
95.5%
10TH GRADE
100.0/ 100
METRIC RATING
25th/ 347
METRIC RANK
94.9%
10TH GRADE
99.6/ 100
METRIC RATING
72nd/ 347
METRIC RANK
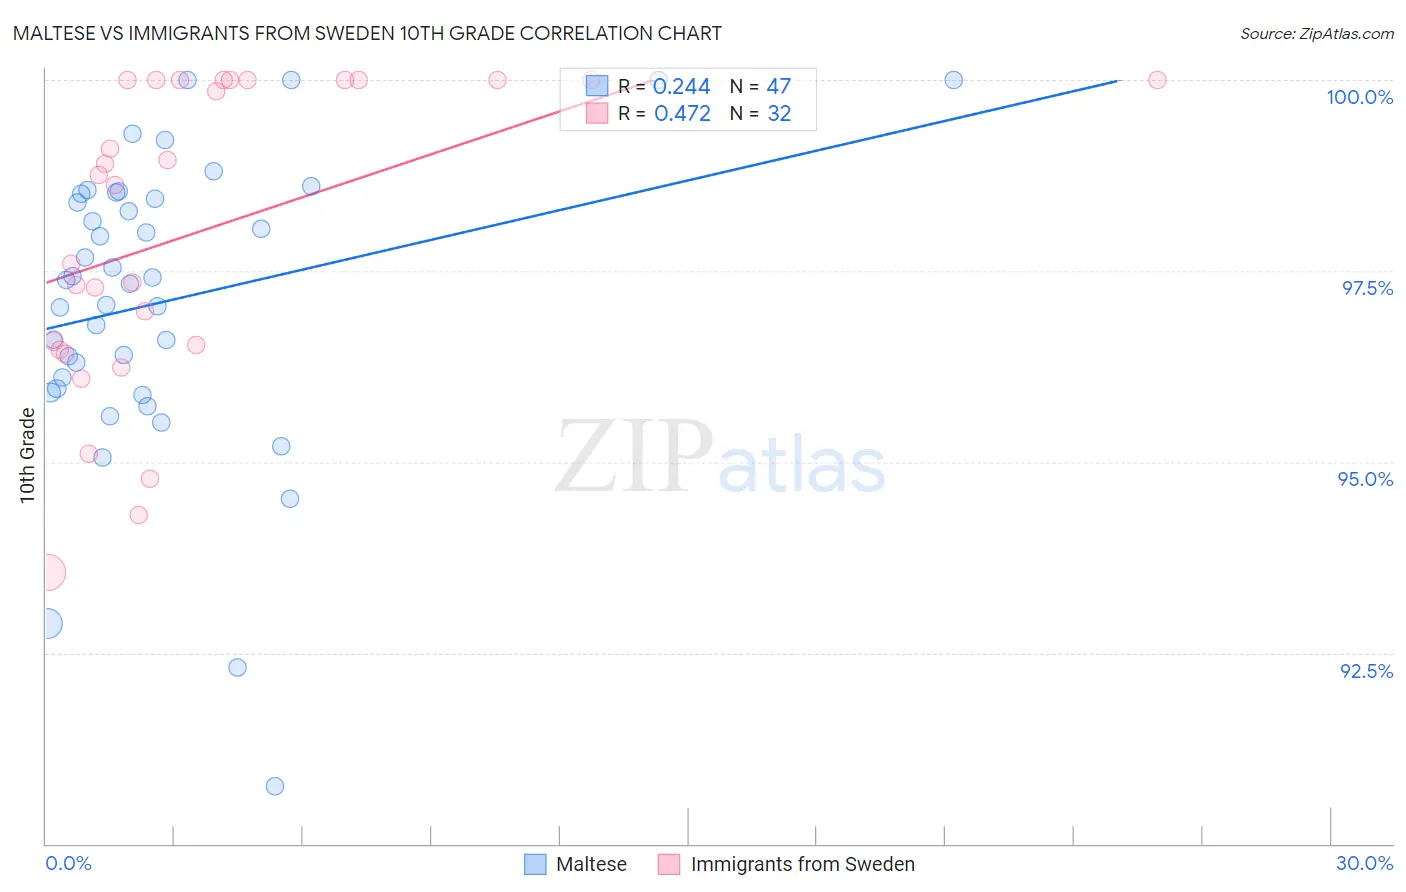
Maltese vs Immigrants from Sweden 10th Grade Correlation Chart
The statistical analysis conducted on geographies consisting of 126,475,193 people shows a weak positive correlation between the proportion of Maltese and percentage of population with at least 10th grade education in the United States with a correlation coefficient (R) of 0.244 and weighted average of 95.5%. Similarly, the statistical analysis conducted on geographies consisting of 164,736,894 people shows a moderate positive correlation between the proportion of Immigrants from Sweden and percentage of population with at least 10th grade education in the United States with a correlation coefficient (R) of 0.472 and weighted average of 94.9%, a difference of 0.62%.
10th Grade Correlation Summary
| Measurement | Maltese | Immigrants from Sweden |
| Minimum | 90.8% | 93.5% |
| Maximum | 100.0% | 100.0% |
| Range | 9.2% | 6.5% |
| Mean | 97.1% | 98.0% |
| Median | 97.4% | 98.7% |
| Interquartile 25% (IQ1) | 96.0% | 96.5% |
| Interquartile 75% (IQ3) | 98.5% | 100.0% |
| Interquartile Range (IQR) | 2.6% | 3.5% |
| Standard Deviation (Sample) | 2.0% | 2.0% |
| Standard Deviation (Population) | 1.9% | 2.0% |
Similar Demographics by 10th Grade
Demographics Similar to Maltese by 10th Grade
In terms of 10th grade, the demographic groups most similar to Maltese are European (95.5%, a difference of 0.0%), Czech (95.5%, a difference of 0.020%), Welsh (95.5%, a difference of 0.020%), Eastern European (95.5%, a difference of 0.030%), and Alaskan Athabascan (95.4%, a difference of 0.040%).
| Demographics | Rating | Rank | 10th Grade |
| Italians | 100.0 /100 | #18 | Exceptional 95.6% |
| Scandinavians | 100.0 /100 | #19 | Exceptional 95.6% |
| Chinese | 100.0 /100 | #20 | Exceptional 95.5% |
| Dutch | 100.0 /100 | #21 | Exceptional 95.5% |
| Eastern Europeans | 100.0 /100 | #22 | Exceptional 95.5% |
| Czechs | 100.0 /100 | #23 | Exceptional 95.5% |
| Europeans | 100.0 /100 | #24 | Exceptional 95.5% |
| Maltese | 100.0 /100 | #25 | Exceptional 95.5% |
| Welsh | 100.0 /100 | #26 | Exceptional 95.5% |
| Alaskan Athabascans | 100.0 /100 | #27 | Exceptional 95.4% |
| Luxembourgers | 100.0 /100 | #28 | Exceptional 95.4% |
| Bulgarians | 100.0 /100 | #29 | Exceptional 95.4% |
| Belgians | 100.0 /100 | #30 | Exceptional 95.4% |
| Iranians | 100.0 /100 | #31 | Exceptional 95.3% |
| Hungarians | 100.0 /100 | #32 | Exceptional 95.3% |
Demographics Similar to Immigrants from Sweden by 10th Grade
In terms of 10th grade, the demographic groups most similar to Immigrants from Sweden are Bhutanese (94.9%, a difference of 0.010%), Canadian (94.9%, a difference of 0.010%), Zimbabwean (94.9%, a difference of 0.020%), Alaska Native (94.9%, a difference of 0.020%), and Immigrants from England (94.9%, a difference of 0.030%).
| Demographics | Rating | Rank | 10th Grade |
| Turks | 99.7 /100 | #65 | Exceptional 95.0% |
| Immigrants | Australia | 99.7 /100 | #66 | Exceptional 94.9% |
| Immigrants | Netherlands | 99.7 /100 | #67 | Exceptional 94.9% |
| Immigrants | Belgium | 99.7 /100 | #68 | Exceptional 94.9% |
| Immigrants | England | 99.6 /100 | #69 | Exceptional 94.9% |
| Zimbabweans | 99.6 /100 | #70 | Exceptional 94.9% |
| Alaska Natives | 99.6 /100 | #71 | Exceptional 94.9% |
| Immigrants | Sweden | 99.6 /100 | #72 | Exceptional 94.9% |
| Bhutanese | 99.6 /100 | #73 | Exceptional 94.9% |
| Canadians | 99.6 /100 | #74 | Exceptional 94.9% |
| Okinawans | 99.5 /100 | #75 | Exceptional 94.8% |
| Romanians | 99.5 /100 | #76 | Exceptional 94.8% |
| Immigrants | South Africa | 99.5 /100 | #77 | Exceptional 94.8% |
| Filipinos | 99.3 /100 | #78 | Exceptional 94.8% |
| Immigrants | Czechoslovakia | 99.2 /100 | #79 | Exceptional 94.7% |