Luxembourger vs Navajo Family Poverty
COMPARE
Luxembourger
Navajo
Family Poverty
Family Poverty Comparison
Luxembourgers
Navajo
7.2%
FAMILY POVERTY
99.8/ 100
METRIC RATING
17th/ 347
METRIC RANK
18.8%
FAMILY POVERTY
0.0/ 100
METRIC RATING
345th/ 347
METRIC RANK
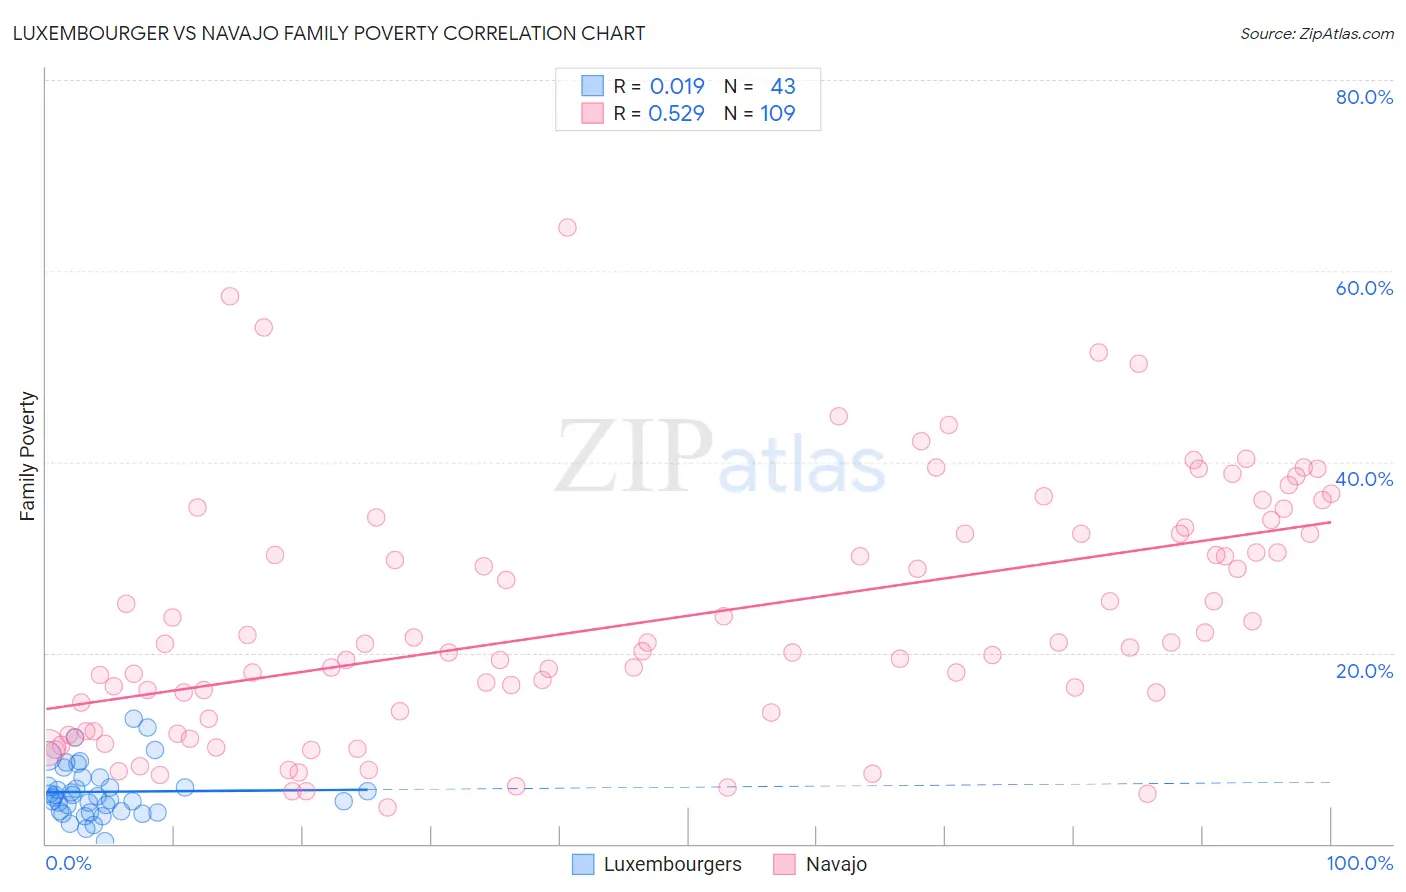
Luxembourger vs Navajo Family Poverty Correlation Chart
The statistical analysis conducted on geographies consisting of 144,473,448 people shows no correlation between the proportion of Luxembourgers and poverty level among families in the United States with a correlation coefficient (R) of 0.019 and weighted average of 7.2%. Similarly, the statistical analysis conducted on geographies consisting of 224,626,486 people shows a substantial positive correlation between the proportion of Navajo and poverty level among families in the United States with a correlation coefficient (R) of 0.529 and weighted average of 18.8%, a difference of 160.5%.
Family Poverty Correlation Summary
| Measurement | Luxembourger | Navajo |
| Minimum | 0.32% | 3.8% |
| Maximum | 13.1% | 64.6% |
| Range | 12.7% | 60.8% |
| Mean | 5.5% | 23.5% |
| Median | 4.9% | 20.9% |
| Interquartile 25% (IQ1) | 3.4% | 13.4% |
| Interquartile 75% (IQ3) | 7.0% | 32.5% |
| Interquartile Range (IQR) | 3.6% | 19.1% |
| Standard Deviation (Sample) | 2.8% | 12.8% |
| Standard Deviation (Population) | 2.8% | 12.8% |
Similar Demographics by Family Poverty
Demographics Similar to Luxembourgers by Family Poverty
In terms of family poverty, the demographic groups most similar to Luxembourgers are Immigrants from Lithuania (7.2%, a difference of 0.010%), Immigrants from South Central Asia (7.2%, a difference of 0.22%), Eastern European (7.2%, a difference of 0.31%), Immigrants from Hong Kong (7.3%, a difference of 0.48%), and Lithuanian (7.2%, a difference of 0.50%).
| Demographics | Rating | Rank | Family Poverty |
| Bulgarians | 99.8 /100 | #10 | Exceptional 7.1% |
| Immigrants | Singapore | 99.8 /100 | #11 | Exceptional 7.1% |
| Maltese | 99.8 /100 | #12 | Exceptional 7.1% |
| Swedes | 99.8 /100 | #13 | Exceptional 7.1% |
| Iranians | 99.8 /100 | #14 | Exceptional 7.1% |
| Lithuanians | 99.8 /100 | #15 | Exceptional 7.2% |
| Immigrants | South Central Asia | 99.8 /100 | #16 | Exceptional 7.2% |
| Luxembourgers | 99.8 /100 | #17 | Exceptional 7.2% |
| Immigrants | Lithuania | 99.8 /100 | #18 | Exceptional 7.2% |
| Eastern Europeans | 99.7 /100 | #19 | Exceptional 7.2% |
| Immigrants | Hong Kong | 99.7 /100 | #20 | Exceptional 7.3% |
| Immigrants | Iran | 99.7 /100 | #21 | Exceptional 7.3% |
| Danes | 99.7 /100 | #22 | Exceptional 7.3% |
| Assyrians/Chaldeans/Syriacs | 99.7 /100 | #23 | Exceptional 7.3% |
| Croatians | 99.7 /100 | #24 | Exceptional 7.3% |
Demographics Similar to Navajo by Family Poverty
In terms of family poverty, the demographic groups most similar to Navajo are Yup'ik (18.7%, a difference of 0.55%), Pima (18.4%, a difference of 2.4%), Immigrants from Yemen (17.5%, a difference of 7.7%), Puerto Rican (20.3%, a difference of 8.1%), and Tohono O'odham (20.4%, a difference of 8.5%).
| Demographics | Rating | Rank | Family Poverty |
| Immigrants | Dominican Republic | 0.0 /100 | #333 | Tragic 14.4% |
| Houma | 0.0 /100 | #334 | Tragic 14.6% |
| Apache | 0.0 /100 | #335 | Tragic 14.7% |
| Sioux | 0.0 /100 | #336 | Tragic 15.9% |
| Hopi | 0.0 /100 | #337 | Tragic 15.9% |
| Crow | 0.0 /100 | #338 | Tragic 16.1% |
| Yuman | 0.0 /100 | #339 | Tragic 16.6% |
| Pueblo | 0.0 /100 | #340 | Tragic 17.0% |
| Lumbee | 0.0 /100 | #341 | Tragic 17.0% |
| Immigrants | Yemen | 0.0 /100 | #342 | Tragic 17.5% |
| Pima | 0.0 /100 | #343 | Tragic 18.4% |
| Yup'ik | 0.0 /100 | #344 | Tragic 18.7% |
| Navajo | 0.0 /100 | #345 | Tragic 18.8% |
| Puerto Ricans | 0.0 /100 | #346 | Tragic 20.3% |
| Tohono O'odham | 0.0 /100 | #347 | Tragic 20.4% |