Luxembourger vs Paiute Family Poverty
COMPARE
Luxembourger
Paiute
Family Poverty
Family Poverty Comparison
Luxembourgers
Paiute
7.2%
FAMILY POVERTY
99.8/ 100
METRIC RATING
17th/ 347
METRIC RANK
13.0%
FAMILY POVERTY
0.0/ 100
METRIC RATING
325th/ 347
METRIC RANK
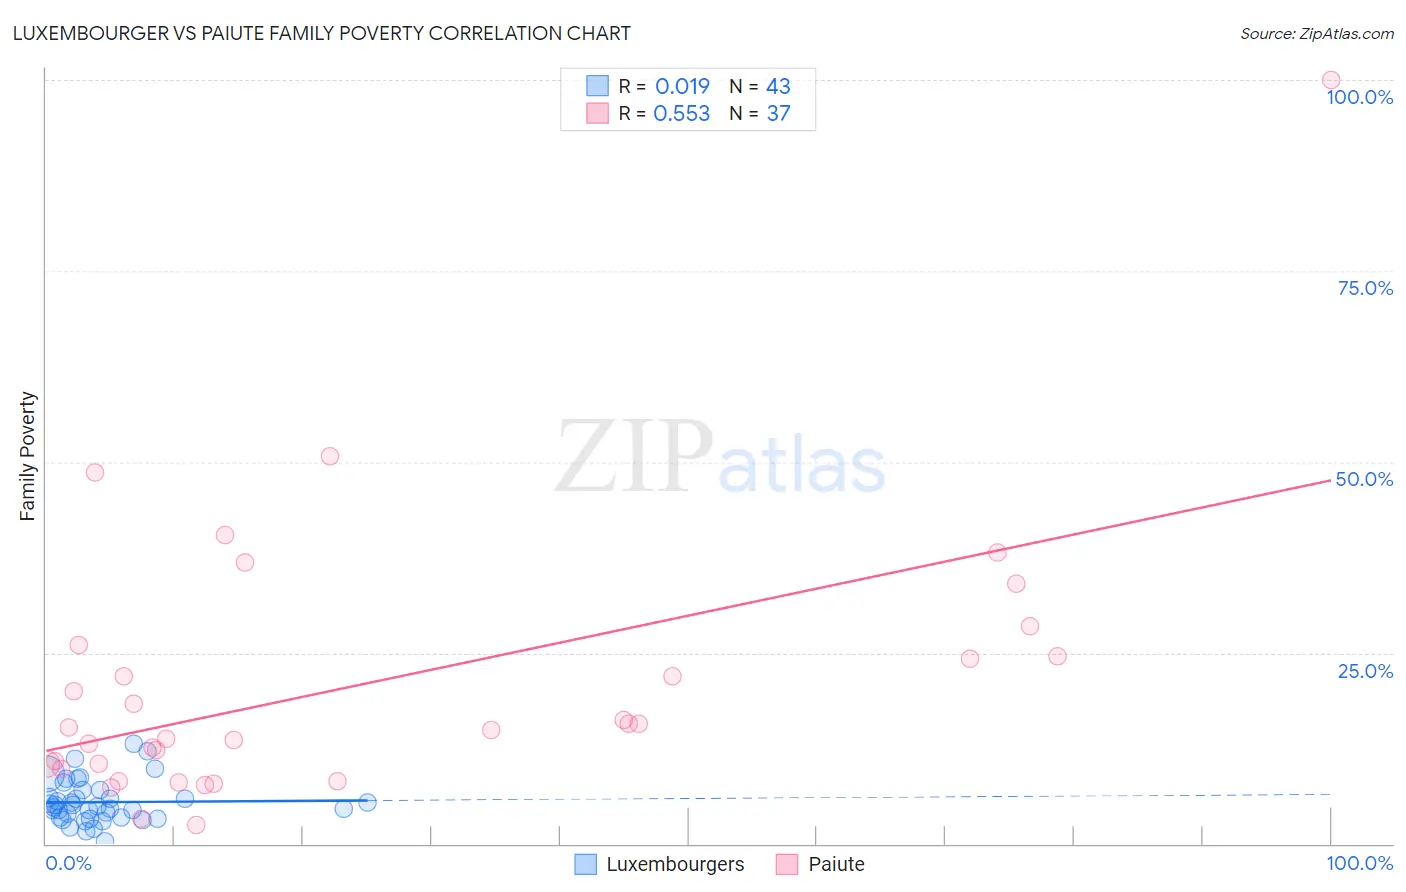
Luxembourger vs Paiute Family Poverty Correlation Chart
The statistical analysis conducted on geographies consisting of 144,473,448 people shows no correlation between the proportion of Luxembourgers and poverty level among families in the United States with a correlation coefficient (R) of 0.019 and weighted average of 7.2%. Similarly, the statistical analysis conducted on geographies consisting of 58,372,907 people shows a substantial positive correlation between the proportion of Paiute and poverty level among families in the United States with a correlation coefficient (R) of 0.553 and weighted average of 13.0%, a difference of 80.0%.
Family Poverty Correlation Summary
| Measurement | Luxembourger | Paiute |
| Minimum | 0.32% | 2.4% |
| Maximum | 13.1% | 100.0% |
| Range | 12.7% | 97.6% |
| Mean | 5.5% | 20.9% |
| Median | 4.9% | 15.2% |
| Interquartile 25% (IQ1) | 3.4% | 10.1% |
| Interquartile 75% (IQ3) | 7.0% | 25.3% |
| Interquartile Range (IQR) | 3.6% | 15.2% |
| Standard Deviation (Sample) | 2.8% | 18.0% |
| Standard Deviation (Population) | 2.8% | 17.8% |
Similar Demographics by Family Poverty
Demographics Similar to Luxembourgers by Family Poverty
In terms of family poverty, the demographic groups most similar to Luxembourgers are Immigrants from Lithuania (7.2%, a difference of 0.010%), Immigrants from South Central Asia (7.2%, a difference of 0.22%), Eastern European (7.2%, a difference of 0.31%), Immigrants from Hong Kong (7.3%, a difference of 0.48%), and Lithuanian (7.2%, a difference of 0.50%).
| Demographics | Rating | Rank | Family Poverty |
| Bulgarians | 99.8 /100 | #10 | Exceptional 7.1% |
| Immigrants | Singapore | 99.8 /100 | #11 | Exceptional 7.1% |
| Maltese | 99.8 /100 | #12 | Exceptional 7.1% |
| Swedes | 99.8 /100 | #13 | Exceptional 7.1% |
| Iranians | 99.8 /100 | #14 | Exceptional 7.1% |
| Lithuanians | 99.8 /100 | #15 | Exceptional 7.2% |
| Immigrants | South Central Asia | 99.8 /100 | #16 | Exceptional 7.2% |
| Luxembourgers | 99.8 /100 | #17 | Exceptional 7.2% |
| Immigrants | Lithuania | 99.8 /100 | #18 | Exceptional 7.2% |
| Eastern Europeans | 99.7 /100 | #19 | Exceptional 7.2% |
| Immigrants | Hong Kong | 99.7 /100 | #20 | Exceptional 7.3% |
| Immigrants | Iran | 99.7 /100 | #21 | Exceptional 7.3% |
| Danes | 99.7 /100 | #22 | Exceptional 7.3% |
| Assyrians/Chaldeans/Syriacs | 99.7 /100 | #23 | Exceptional 7.3% |
| Croatians | 99.7 /100 | #24 | Exceptional 7.3% |
Demographics Similar to Paiute by Family Poverty
In terms of family poverty, the demographic groups most similar to Paiute are Colville (13.0%, a difference of 0.060%), Yakama (13.1%, a difference of 0.75%), Immigrants from Dominica (12.7%, a difference of 2.0%), Menominee (12.7%, a difference of 2.0%), and Central American Indian (13.3%, a difference of 2.4%).
| Demographics | Rating | Rank | Family Poverty |
| U.S. Virgin Islanders | 0.0 /100 | #318 | Tragic 12.4% |
| British West Indians | 0.0 /100 | #319 | Tragic 12.4% |
| Inupiat | 0.0 /100 | #320 | Tragic 12.5% |
| Arapaho | 0.0 /100 | #321 | Tragic 12.7% |
| Immigrants | Honduras | 0.0 /100 | #322 | Tragic 12.7% |
| Menominee | 0.0 /100 | #323 | Tragic 12.7% |
| Immigrants | Dominica | 0.0 /100 | #324 | Tragic 12.7% |
| Paiute | 0.0 /100 | #325 | Tragic 13.0% |
| Colville | 0.0 /100 | #326 | Tragic 13.0% |
| Yakama | 0.0 /100 | #327 | Tragic 13.1% |
| Central American Indians | 0.0 /100 | #328 | Tragic 13.3% |
| Blacks/African Americans | 0.0 /100 | #329 | Tragic 13.3% |
| Natives/Alaskans | 0.0 /100 | #330 | Tragic 14.3% |
| Cheyenne | 0.0 /100 | #331 | Tragic 14.3% |
| Dominicans | 0.0 /100 | #332 | Tragic 14.3% |