Immigrants from Afghanistan vs Navajo Family Poverty
COMPARE
Immigrants from Afghanistan
Navajo
Family Poverty
Family Poverty Comparison
Immigrants from Afghanistan
Navajo
9.2%
FAMILY POVERTY
32.1/ 100
METRIC RATING
189th/ 347
METRIC RANK
18.8%
FAMILY POVERTY
0.0/ 100
METRIC RATING
345th/ 347
METRIC RANK
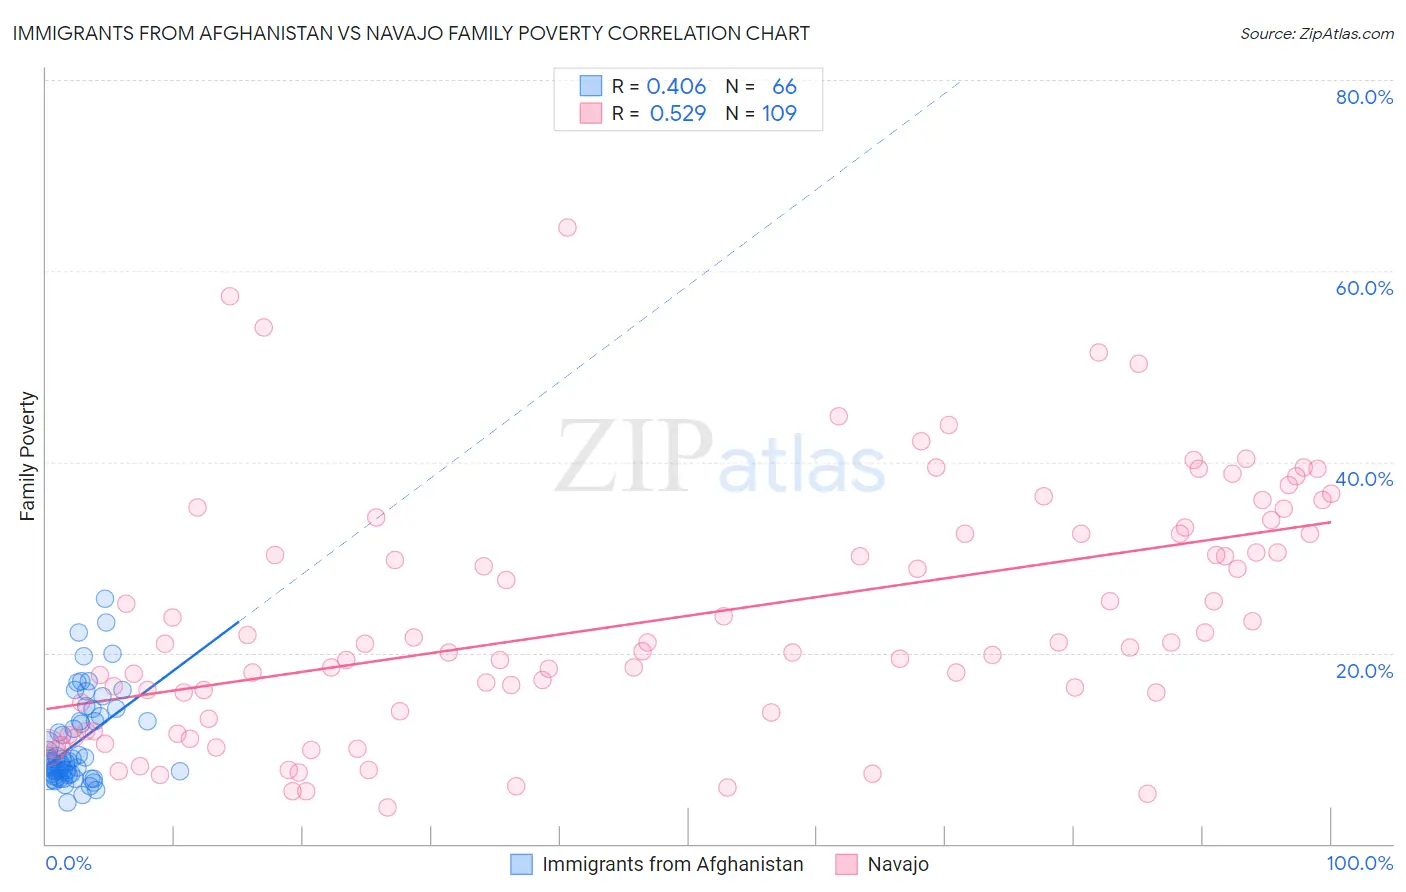
Immigrants from Afghanistan vs Navajo Family Poverty Correlation Chart
The statistical analysis conducted on geographies consisting of 147,487,715 people shows a moderate positive correlation between the proportion of Immigrants from Afghanistan and poverty level among families in the United States with a correlation coefficient (R) of 0.406 and weighted average of 9.2%. Similarly, the statistical analysis conducted on geographies consisting of 224,626,486 people shows a substantial positive correlation between the proportion of Navajo and poverty level among families in the United States with a correlation coefficient (R) of 0.529 and weighted average of 18.8%, a difference of 103.8%.
Family Poverty Correlation Summary
| Measurement | Immigrants from Afghanistan | Navajo |
| Minimum | 4.3% | 3.8% |
| Maximum | 25.6% | 64.6% |
| Range | 21.3% | 60.8% |
| Mean | 10.5% | 23.5% |
| Median | 8.6% | 20.9% |
| Interquartile 25% (IQ1) | 7.2% | 13.4% |
| Interquartile 75% (IQ3) | 12.9% | 32.5% |
| Interquartile Range (IQR) | 5.7% | 19.1% |
| Standard Deviation (Sample) | 4.7% | 12.8% |
| Standard Deviation (Population) | 4.7% | 12.8% |
Similar Demographics by Family Poverty
Demographics Similar to Immigrants from Afghanistan by Family Poverty
In terms of family poverty, the demographic groups most similar to Immigrants from Afghanistan are Arab (9.2%, a difference of 0.090%), Immigrants from Kenya (9.2%, a difference of 0.29%), Delaware (9.2%, a difference of 0.48%), Ugandan (9.3%, a difference of 0.50%), and Spanish (9.3%, a difference of 0.51%).
| Demographics | Rating | Rank | Family Poverty |
| Immigrants | Morocco | 40.2 /100 | #182 | Average 9.1% |
| Uruguayans | 39.2 /100 | #183 | Fair 9.1% |
| South American Indians | 38.7 /100 | #184 | Fair 9.1% |
| Immigrants | Saudi Arabia | 38.6 /100 | #185 | Fair 9.1% |
| Colombians | 36.1 /100 | #186 | Fair 9.2% |
| Delaware | 35.4 /100 | #187 | Fair 9.2% |
| Immigrants | Kenya | 34.0 /100 | #188 | Fair 9.2% |
| Immigrants | Afghanistan | 32.1 /100 | #189 | Fair 9.2% |
| Arabs | 31.5 /100 | #190 | Fair 9.2% |
| Ugandans | 28.7 /100 | #191 | Fair 9.3% |
| Spanish | 28.7 /100 | #192 | Fair 9.3% |
| Immigrants | Western Asia | 28.2 /100 | #193 | Fair 9.3% |
| South Americans | 28.1 /100 | #194 | Fair 9.3% |
| Venezuelans | 27.4 /100 | #195 | Fair 9.3% |
| Immigrants | Venezuela | 26.1 /100 | #196 | Fair 9.3% |
Demographics Similar to Navajo by Family Poverty
In terms of family poverty, the demographic groups most similar to Navajo are Yup'ik (18.7%, a difference of 0.55%), Pima (18.4%, a difference of 2.4%), Immigrants from Yemen (17.5%, a difference of 7.7%), Puerto Rican (20.3%, a difference of 8.1%), and Tohono O'odham (20.4%, a difference of 8.5%).
| Demographics | Rating | Rank | Family Poverty |
| Immigrants | Dominican Republic | 0.0 /100 | #333 | Tragic 14.4% |
| Houma | 0.0 /100 | #334 | Tragic 14.6% |
| Apache | 0.0 /100 | #335 | Tragic 14.7% |
| Sioux | 0.0 /100 | #336 | Tragic 15.9% |
| Hopi | 0.0 /100 | #337 | Tragic 15.9% |
| Crow | 0.0 /100 | #338 | Tragic 16.1% |
| Yuman | 0.0 /100 | #339 | Tragic 16.6% |
| Pueblo | 0.0 /100 | #340 | Tragic 17.0% |
| Lumbee | 0.0 /100 | #341 | Tragic 17.0% |
| Immigrants | Yemen | 0.0 /100 | #342 | Tragic 17.5% |
| Pima | 0.0 /100 | #343 | Tragic 18.4% |
| Yup'ik | 0.0 /100 | #344 | Tragic 18.7% |
| Navajo | 0.0 /100 | #345 | Tragic 18.8% |
| Puerto Ricans | 0.0 /100 | #346 | Tragic 20.3% |
| Tohono O'odham | 0.0 /100 | #347 | Tragic 20.4% |