American vs Immigrants from Micronesia Child Poverty Among Girls Under 16
COMPARE
American
Immigrants from Micronesia
Child Poverty Among Girls Under 16
Child Poverty Among Girls Under 16 Comparison
Americans
Immigrants from Micronesia
18.8%
CHILD POVERTY AMONG GIRLS UNDER 16
0.8/ 100
METRIC RATING
241st/ 347
METRIC RANK
18.0%
CHILD POVERTY AMONG GIRLS UNDER 16
3.5/ 100
METRIC RATING
221st/ 347
METRIC RANK
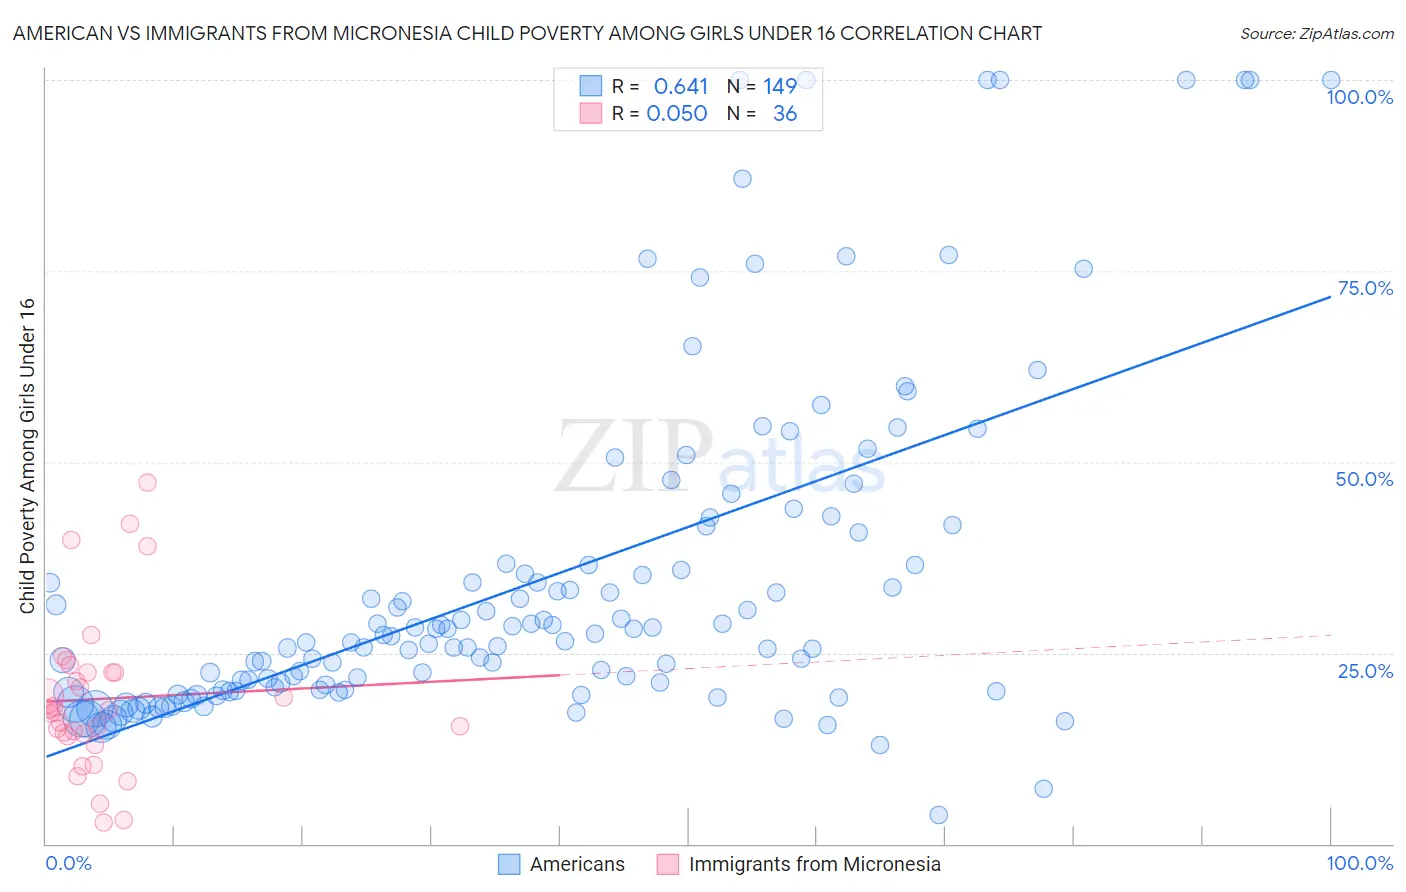
American vs Immigrants from Micronesia Child Poverty Among Girls Under 16 Correlation Chart
The statistical analysis conducted on geographies consisting of 557,572,763 people shows a significant positive correlation between the proportion of Americans and poverty level among girls under the age of 16 in the United States with a correlation coefficient (R) of 0.641 and weighted average of 18.8%. Similarly, the statistical analysis conducted on geographies consisting of 61,520,772 people shows no correlation between the proportion of Immigrants from Micronesia and poverty level among girls under the age of 16 in the United States with a correlation coefficient (R) of 0.050 and weighted average of 18.0%, a difference of 4.0%.
Child Poverty Among Girls Under 16 Correlation Summary
| Measurement | American | Immigrants from Micronesia |
| Minimum | 3.7% | 2.8% |
| Maximum | 100.0% | 47.3% |
| Range | 96.3% | 44.6% |
| Mean | 34.4% | 19.0% |
| Median | 26.6% | 17.4% |
| Interquartile 25% (IQ1) | 20.0% | 14.3% |
| Interquartile 75% (IQ3) | 36.6% | 22.4% |
| Interquartile Range (IQR) | 16.5% | 8.2% |
| Standard Deviation (Sample) | 21.9% | 10.2% |
| Standard Deviation (Population) | 21.9% | 10.0% |
Demographics Similar to Americans and Immigrants from Micronesia by Child Poverty Among Girls Under 16
In terms of child poverty among girls under 16, the demographic groups most similar to Americans are Nigerian (18.7%, a difference of 0.32%), Marshallese (18.7%, a difference of 0.47%), Immigrants from Eritrea (18.7%, a difference of 0.54%), Immigrants from Nigeria (18.6%, a difference of 0.67%), and Alsatian (18.6%, a difference of 0.80%). Similarly, the demographic groups most similar to Immigrants from Micronesia are Immigrants from Cambodia (18.1%, a difference of 0.52%), Immigrants from Armenia (18.1%, a difference of 0.52%), Bermudan (18.1%, a difference of 0.60%), Immigrants from Africa (18.2%, a difference of 0.69%), and Nicaraguan (18.2%, a difference of 1.0%).
| Demographics | Rating | Rank | Child Poverty Among Girls Under 16 |
| Immigrants | Micronesia | 3.5 /100 | #221 | Tragic 18.0% |
| Immigrants | Cambodia | 2.9 /100 | #222 | Tragic 18.1% |
| Immigrants | Armenia | 2.9 /100 | #223 | Tragic 18.1% |
| Bermudans | 2.8 /100 | #224 | Tragic 18.1% |
| Immigrants | Africa | 2.7 /100 | #225 | Tragic 18.2% |
| Nicaraguans | 2.4 /100 | #226 | Tragic 18.2% |
| Immigrants | Nonimmigrants | 2.0 /100 | #227 | Tragic 18.3% |
| Alaskan Athabascans | 2.0 /100 | #228 | Tragic 18.3% |
| Ghanaians | 1.4 /100 | #229 | Tragic 18.5% |
| Osage | 1.3 /100 | #230 | Tragic 18.5% |
| Cree | 1.3 /100 | #231 | Tragic 18.5% |
| Immigrants | Sudan | 1.1 /100 | #232 | Tragic 18.6% |
| Sudanese | 1.1 /100 | #233 | Tragic 18.6% |
| Fijians | 1.1 /100 | #234 | Tragic 18.6% |
| Nepalese | 1.1 /100 | #235 | Tragic 18.6% |
| Alsatians | 1.1 /100 | #236 | Tragic 18.6% |
| Immigrants | Nigeria | 1.0 /100 | #237 | Tragic 18.6% |
| Immigrants | Eritrea | 1.0 /100 | #238 | Tragic 18.7% |
| Marshallese | 0.9 /100 | #239 | Tragic 18.7% |
| Nigerians | 0.9 /100 | #240 | Tragic 18.7% |
| Americans | 0.8 /100 | #241 | Tragic 18.8% |