Luxembourger vs Immigrants from Russia Child Poverty Among Girls Under 16
COMPARE
Luxembourger
Immigrants from Russia
Child Poverty Among Girls Under 16
Child Poverty Among Girls Under 16 Comparison
Luxembourgers
Immigrants from Russia
14.3%
CHILD POVERTY AMONG GIRLS UNDER 16
99.0/ 100
METRIC RATING
53rd/ 347
METRIC RANK
14.7%
CHILD POVERTY AMONG GIRLS UNDER 16
97.9/ 100
METRIC RATING
76th/ 347
METRIC RANK
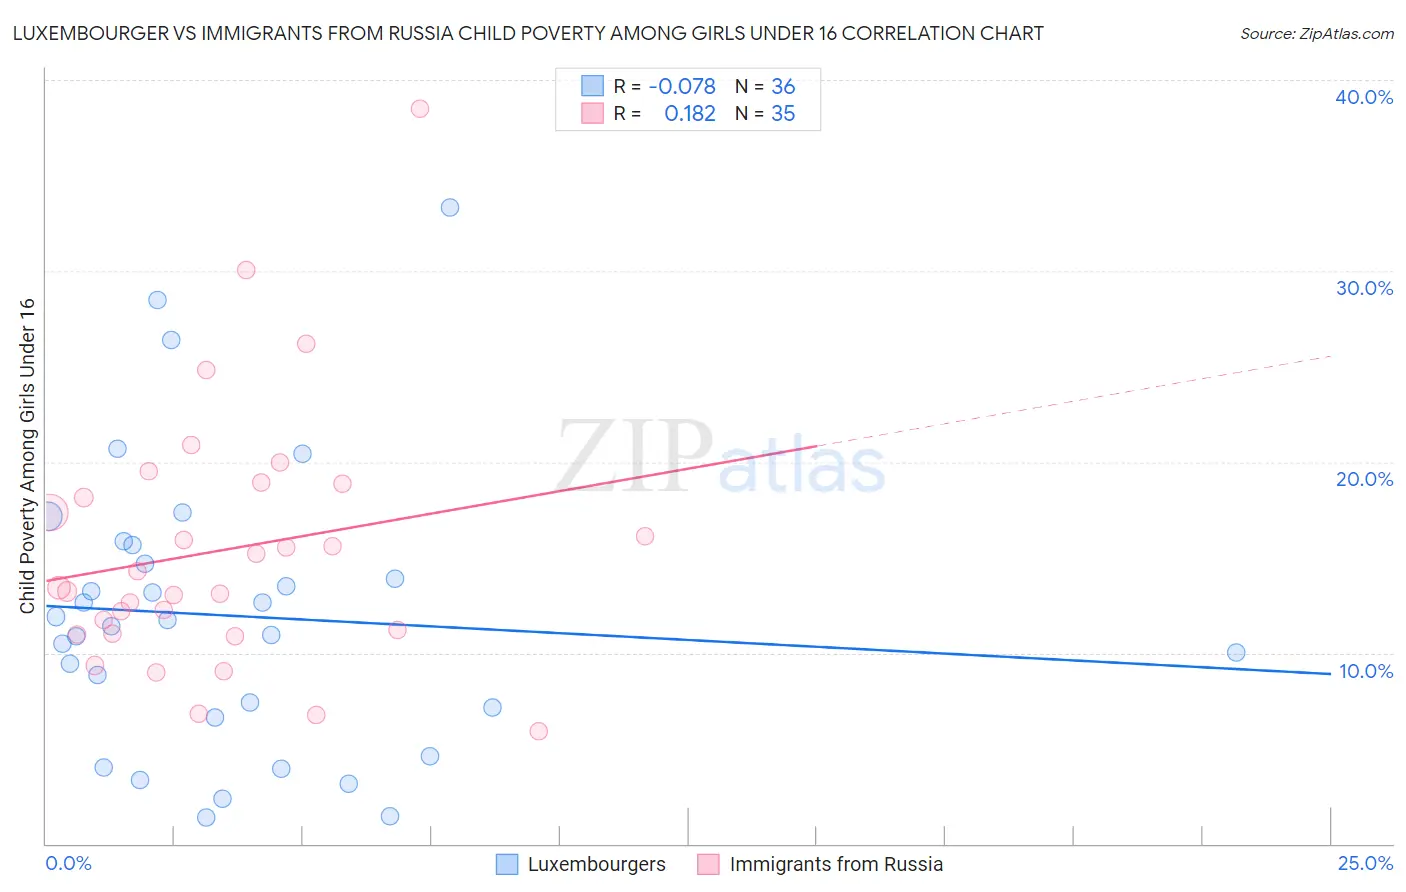
Luxembourger vs Immigrants from Russia Child Poverty Among Girls Under 16 Correlation Chart
The statistical analysis conducted on geographies consisting of 142,903,603 people shows a slight negative correlation between the proportion of Luxembourgers and poverty level among girls under the age of 16 in the United States with a correlation coefficient (R) of -0.078 and weighted average of 14.3%. Similarly, the statistical analysis conducted on geographies consisting of 341,568,734 people shows a poor positive correlation between the proportion of Immigrants from Russia and poverty level among girls under the age of 16 in the United States with a correlation coefficient (R) of 0.182 and weighted average of 14.7%, a difference of 2.6%.
Child Poverty Among Girls Under 16 Correlation Summary
| Measurement | Luxembourger | Immigrants from Russia |
| Minimum | 1.4% | 5.9% |
| Maximum | 33.3% | 38.5% |
| Range | 32.0% | 32.6% |
| Mean | 11.9% | 15.4% |
| Median | 11.6% | 13.4% |
| Interquartile 25% (IQ1) | 6.9% | 11.0% |
| Interquartile 75% (IQ3) | 15.2% | 18.9% |
| Interquartile Range (IQR) | 8.3% | 7.9% |
| Standard Deviation (Sample) | 7.4% | 6.8% |
| Standard Deviation (Population) | 7.3% | 6.7% |
Similar Demographics by Child Poverty Among Girls Under 16
Demographics Similar to Luxembourgers by Child Poverty Among Girls Under 16
In terms of child poverty among girls under 16, the demographic groups most similar to Luxembourgers are Italian (14.3%, a difference of 0.070%), Immigrants from Pakistan (14.2%, a difference of 0.21%), Estonian (14.3%, a difference of 0.43%), Immigrants from Romania (14.3%, a difference of 0.47%), and Immigrants from Indonesia (14.4%, a difference of 0.54%).
| Demographics | Rating | Rank | Child Poverty Among Girls Under 16 |
| Croatians | 99.3 /100 | #46 | Exceptional 14.1% |
| Immigrants | Czechoslovakia | 99.3 /100 | #47 | Exceptional 14.2% |
| Czechs | 99.3 /100 | #48 | Exceptional 14.2% |
| Greeks | 99.2 /100 | #49 | Exceptional 14.2% |
| Immigrants | Israel | 99.2 /100 | #50 | Exceptional 14.2% |
| Immigrants | Pakistan | 99.1 /100 | #51 | Exceptional 14.2% |
| Italians | 99.1 /100 | #52 | Exceptional 14.3% |
| Luxembourgers | 99.0 /100 | #53 | Exceptional 14.3% |
| Estonians | 98.9 /100 | #54 | Exceptional 14.3% |
| Immigrants | Romania | 98.9 /100 | #55 | Exceptional 14.3% |
| Immigrants | Indonesia | 98.9 /100 | #56 | Exceptional 14.4% |
| Immigrants | Serbia | 98.9 /100 | #57 | Exceptional 14.4% |
| Immigrants | Bulgaria | 98.8 /100 | #58 | Exceptional 14.4% |
| Zimbabweans | 98.8 /100 | #59 | Exceptional 14.4% |
| Poles | 98.7 /100 | #60 | Exceptional 14.4% |
Demographics Similar to Immigrants from Russia by Child Poverty Among Girls Under 16
In terms of child poverty among girls under 16, the demographic groups most similar to Immigrants from Russia are Tlingit-Haida (14.7%, a difference of 0.010%), Argentinean (14.7%, a difference of 0.020%), Immigrants from Turkey (14.7%, a difference of 0.030%), Egyptian (14.7%, a difference of 0.040%), and Immigrants from Eastern Europe (14.6%, a difference of 0.15%).
| Demographics | Rating | Rank | Child Poverty Among Girls Under 16 |
| Immigrants | Poland | 98.2 /100 | #69 | Exceptional 14.6% |
| Europeans | 98.1 /100 | #70 | Exceptional 14.6% |
| Slovenes | 98.1 /100 | #71 | Exceptional 14.6% |
| Immigrants | Netherlands | 98.1 /100 | #72 | Exceptional 14.6% |
| Immigrants | Austria | 98.0 /100 | #73 | Exceptional 14.6% |
| Taiwanese | 98.0 /100 | #74 | Exceptional 14.6% |
| Immigrants | Eastern Europe | 98.0 /100 | #75 | Exceptional 14.6% |
| Immigrants | Russia | 97.9 /100 | #76 | Exceptional 14.7% |
| Tlingit-Haida | 97.9 /100 | #77 | Exceptional 14.7% |
| Argentineans | 97.9 /100 | #78 | Exceptional 14.7% |
| Immigrants | Turkey | 97.9 /100 | #79 | Exceptional 14.7% |
| Egyptians | 97.9 /100 | #80 | Exceptional 14.7% |
| Ukrainians | 97.7 /100 | #81 | Exceptional 14.7% |
| Macedonians | 97.6 /100 | #82 | Exceptional 14.7% |
| Immigrants | Italy | 97.4 /100 | #83 | Exceptional 14.8% |