Lumbee vs Croatian 10th Grade
COMPARE
Lumbee
Croatian
10th Grade
10th Grade Comparison
Lumbee
Croatians
91.7%
10TH GRADE
0.0/ 100
METRIC RATING
295th/ 347
METRIC RANK
95.7%
10TH GRADE
100.0/ 100
METRIC RATING
10th/ 347
METRIC RANK
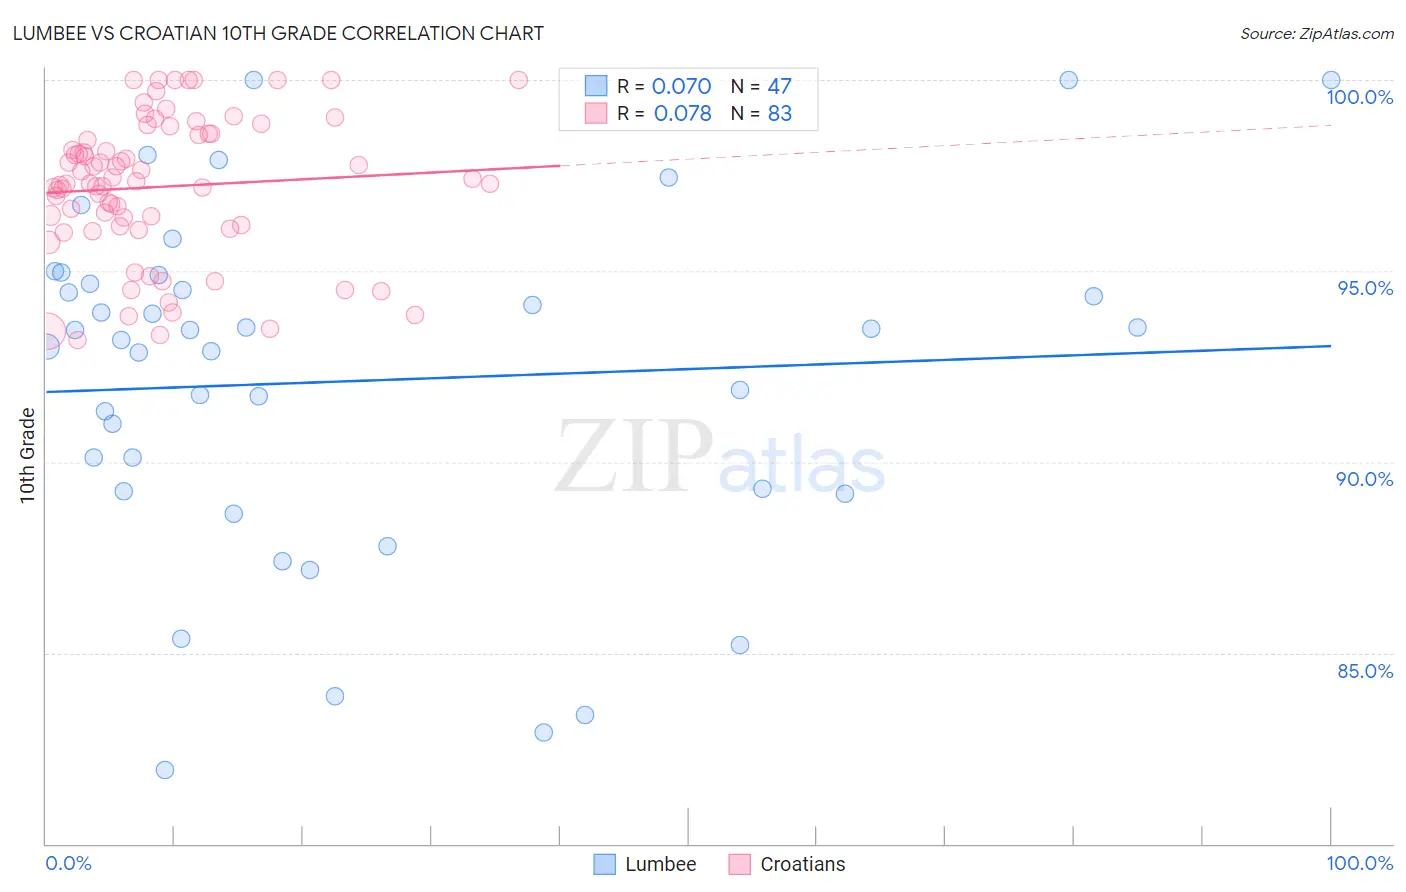
Lumbee vs Croatian 10th Grade Correlation Chart
The statistical analysis conducted on geographies consisting of 92,299,110 people shows a slight positive correlation between the proportion of Lumbee and percentage of population with at least 10th grade education in the United States with a correlation coefficient (R) of 0.070 and weighted average of 91.7%. Similarly, the statistical analysis conducted on geographies consisting of 375,734,264 people shows a slight positive correlation between the proportion of Croatians and percentage of population with at least 10th grade education in the United States with a correlation coefficient (R) of 0.078 and weighted average of 95.7%, a difference of 4.3%.
10th Grade Correlation Summary
| Measurement | Lumbee | Croatian |
| Minimum | 81.9% | 93.2% |
| Maximum | 100.0% | 100.0% |
| Range | 18.1% | 6.8% |
| Mean | 92.1% | 97.2% |
| Median | 93.2% | 97.3% |
| Interquartile 25% (IQ1) | 89.2% | 96.2% |
| Interquartile 75% (IQ3) | 94.7% | 98.6% |
| Interquartile Range (IQR) | 5.4% | 2.4% |
| Standard Deviation (Sample) | 4.5% | 1.8% |
| Standard Deviation (Population) | 4.4% | 1.8% |
Similar Demographics by 10th Grade
Demographics Similar to Lumbee by 10th Grade
In terms of 10th grade, the demographic groups most similar to Lumbee are Haitian (91.8%, a difference of 0.030%), Indonesian (91.8%, a difference of 0.060%), Immigrants from West Indies (91.8%, a difference of 0.080%), Immigrants from Burma/Myanmar (91.8%, a difference of 0.080%), and British West Indian (91.8%, a difference of 0.090%).
| Demographics | Rating | Rank | 10th Grade |
| Immigrants | Laos | 0.0 /100 | #288 | Tragic 91.9% |
| Sri Lankans | 0.0 /100 | #289 | Tragic 91.8% |
| British West Indians | 0.0 /100 | #290 | Tragic 91.8% |
| Immigrants | West Indies | 0.0 /100 | #291 | Tragic 91.8% |
| Immigrants | Burma/Myanmar | 0.0 /100 | #292 | Tragic 91.8% |
| Indonesians | 0.0 /100 | #293 | Tragic 91.8% |
| Haitians | 0.0 /100 | #294 | Tragic 91.8% |
| Lumbee | 0.0 /100 | #295 | Tragic 91.7% |
| Immigrants | Grenada | 0.0 /100 | #296 | Tragic 91.6% |
| Fijians | 0.0 /100 | #297 | Tragic 91.5% |
| Cubans | 0.0 /100 | #298 | Tragic 91.5% |
| Immigrants | Haiti | 0.0 /100 | #299 | Tragic 91.4% |
| Guyanese | 0.0 /100 | #300 | Tragic 91.4% |
| Japanese | 0.0 /100 | #301 | Tragic 91.2% |
| Immigrants | Guyana | 0.0 /100 | #302 | Tragic 91.2% |
Demographics Similar to Croatians by 10th Grade
In terms of 10th grade, the demographic groups most similar to Croatians are Finnish (95.8%, a difference of 0.020%), Danish (95.7%, a difference of 0.040%), Lithuanian (95.8%, a difference of 0.080%), Tlingit-Haida (95.7%, a difference of 0.080%), and German (95.8%, a difference of 0.090%).
| Demographics | Rating | Rank | 10th Grade |
| Slovenes | 100.0 /100 | #3 | Exceptional 95.9% |
| Swedes | 100.0 /100 | #4 | Exceptional 95.9% |
| Carpatho Rusyns | 100.0 /100 | #5 | Exceptional 95.9% |
| Poles | 100.0 /100 | #6 | Exceptional 95.8% |
| Germans | 100.0 /100 | #7 | Exceptional 95.8% |
| Lithuanians | 100.0 /100 | #8 | Exceptional 95.8% |
| Finns | 100.0 /100 | #9 | Exceptional 95.8% |
| Croatians | 100.0 /100 | #10 | Exceptional 95.7% |
| Danes | 100.0 /100 | #11 | Exceptional 95.7% |
| Tlingit-Haida | 100.0 /100 | #12 | Exceptional 95.7% |
| English | 100.0 /100 | #13 | Exceptional 95.6% |
| Tsimshian | 100.0 /100 | #14 | Exceptional 95.6% |
| Irish | 100.0 /100 | #15 | Exceptional 95.6% |
| Scottish | 100.0 /100 | #16 | Exceptional 95.6% |
| Latvians | 100.0 /100 | #17 | Exceptional 95.6% |