Lithuanian vs Malaysian Female Poverty
COMPARE
Lithuanian
Malaysian
Female Poverty
Female Poverty Comparison
Lithuanians
Malaysians
11.4%
FEMALE POVERTY
99.8/ 100
METRIC RATING
14th/ 347
METRIC RANK
14.3%
FEMALE POVERTY
7.4/ 100
METRIC RATING
210th/ 347
METRIC RANK
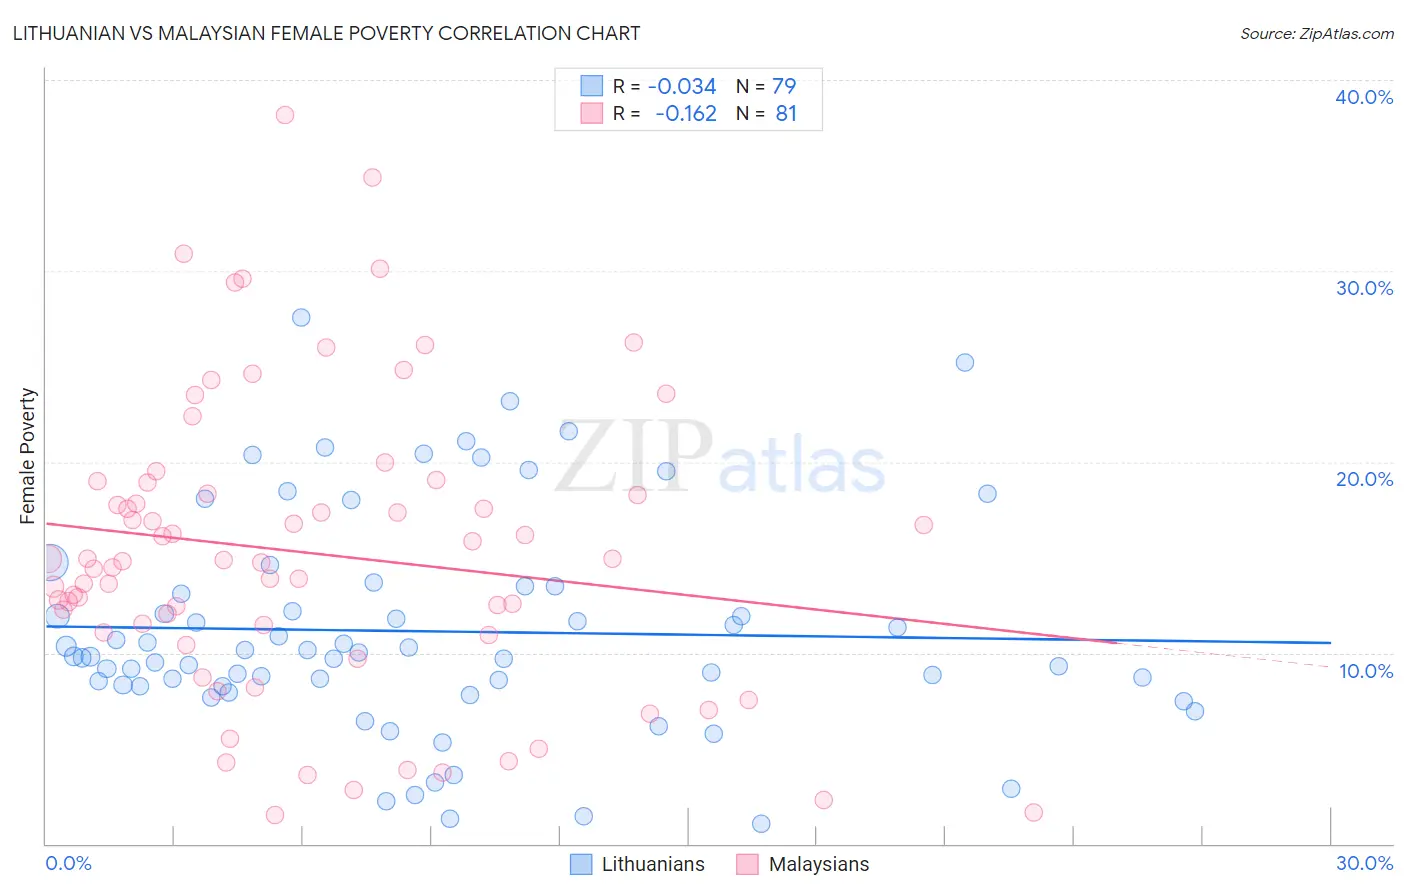
Lithuanian vs Malaysian Female Poverty Correlation Chart
The statistical analysis conducted on geographies consisting of 421,598,229 people shows no correlation between the proportion of Lithuanians and poverty level among females in the United States with a correlation coefficient (R) of -0.034 and weighted average of 11.4%. Similarly, the statistical analysis conducted on geographies consisting of 225,983,571 people shows a poor negative correlation between the proportion of Malaysians and poverty level among females in the United States with a correlation coefficient (R) of -0.162 and weighted average of 14.3%, a difference of 25.2%.
Female Poverty Correlation Summary
| Measurement | Lithuanian | Malaysian |
| Minimum | 1.0% | 1.5% |
| Maximum | 27.5% | 38.2% |
| Range | 26.5% | 36.7% |
| Mean | 11.1% | 15.2% |
| Median | 9.8% | 14.8% |
| Interquartile 25% (IQ1) | 8.2% | 11.0% |
| Interquartile 75% (IQ3) | 13.5% | 18.7% |
| Interquartile Range (IQR) | 5.2% | 7.6% |
| Standard Deviation (Sample) | 5.7% | 7.8% |
| Standard Deviation (Population) | 5.6% | 7.7% |
Similar Demographics by Female Poverty
Demographics Similar to Lithuanians by Female Poverty
In terms of female poverty, the demographic groups most similar to Lithuanians are Latvian (11.4%, a difference of 0.32%), Immigrants from Bolivia (11.5%, a difference of 0.80%), Bolivian (11.5%, a difference of 0.87%), Immigrants from Scotland (11.5%, a difference of 0.92%), and Immigrants from Lithuania (11.3%, a difference of 0.96%).
| Demographics | Rating | Rank | Female Poverty |
| Assyrians/Chaldeans/Syriacs | 99.9 /100 | #7 | Exceptional 11.0% |
| Immigrants | South Central Asia | 99.9 /100 | #8 | Exceptional 11.1% |
| Bulgarians | 99.9 /100 | #9 | Exceptional 11.1% |
| Immigrants | Hong Kong | 99.9 /100 | #10 | Exceptional 11.2% |
| Maltese | 99.9 /100 | #11 | Exceptional 11.2% |
| Bhutanese | 99.9 /100 | #12 | Exceptional 11.3% |
| Immigrants | Lithuania | 99.9 /100 | #13 | Exceptional 11.3% |
| Lithuanians | 99.8 /100 | #14 | Exceptional 11.4% |
| Latvians | 99.8 /100 | #15 | Exceptional 11.4% |
| Immigrants | Bolivia | 99.8 /100 | #16 | Exceptional 11.5% |
| Bolivians | 99.8 /100 | #17 | Exceptional 11.5% |
| Immigrants | Scotland | 99.8 /100 | #18 | Exceptional 11.5% |
| Norwegians | 99.8 /100 | #19 | Exceptional 11.5% |
| Eastern Europeans | 99.7 /100 | #20 | Exceptional 11.5% |
| Italians | 99.7 /100 | #21 | Exceptional 11.6% |
Demographics Similar to Malaysians by Female Poverty
In terms of female poverty, the demographic groups most similar to Malaysians are Panamanian (14.2%, a difference of 0.080%), Moroccan (14.3%, a difference of 0.080%), Immigrants from the Azores (14.2%, a difference of 0.15%), Immigrants from Eastern Africa (14.2%, a difference of 0.49%), and Bermudan (14.4%, a difference of 0.72%).
| Demographics | Rating | Rank | Female Poverty |
| Immigrants | Western Asia | 20.7 /100 | #203 | Fair 13.9% |
| Spaniards | 18.9 /100 | #204 | Poor 13.9% |
| Ugandans | 15.4 /100 | #205 | Poor 14.0% |
| Immigrants | Uruguay | 14.0 /100 | #206 | Poor 14.0% |
| Immigrants | Eastern Africa | 9.0 /100 | #207 | Tragic 14.2% |
| Immigrants | Azores | 7.9 /100 | #208 | Tragic 14.2% |
| Panamanians | 7.7 /100 | #209 | Tragic 14.2% |
| Malaysians | 7.4 /100 | #210 | Tragic 14.3% |
| Moroccans | 7.2 /100 | #211 | Tragic 14.3% |
| Bermudans | 5.5 /100 | #212 | Tragic 14.4% |
| Alaskan Athabascans | 5.3 /100 | #213 | Tragic 14.4% |
| Marshallese | 5.0 /100 | #214 | Tragic 14.4% |
| Immigrants | Panama | 4.7 /100 | #215 | Tragic 14.4% |
| Immigrants | Thailand | 4.5 /100 | #216 | Tragic 14.4% |
| Immigrants | Immigrants | 4.5 /100 | #217 | Tragic 14.4% |