Immigrants from Colombia vs Malaysian Female Poverty
COMPARE
Immigrants from Colombia
Malaysian
Female Poverty
Female Poverty Comparison
Immigrants from Colombia
Malaysians
13.5%
FEMALE POVERTY
44.5/ 100
METRIC RATING
182nd/ 347
METRIC RANK
14.3%
FEMALE POVERTY
7.4/ 100
METRIC RATING
210th/ 347
METRIC RANK
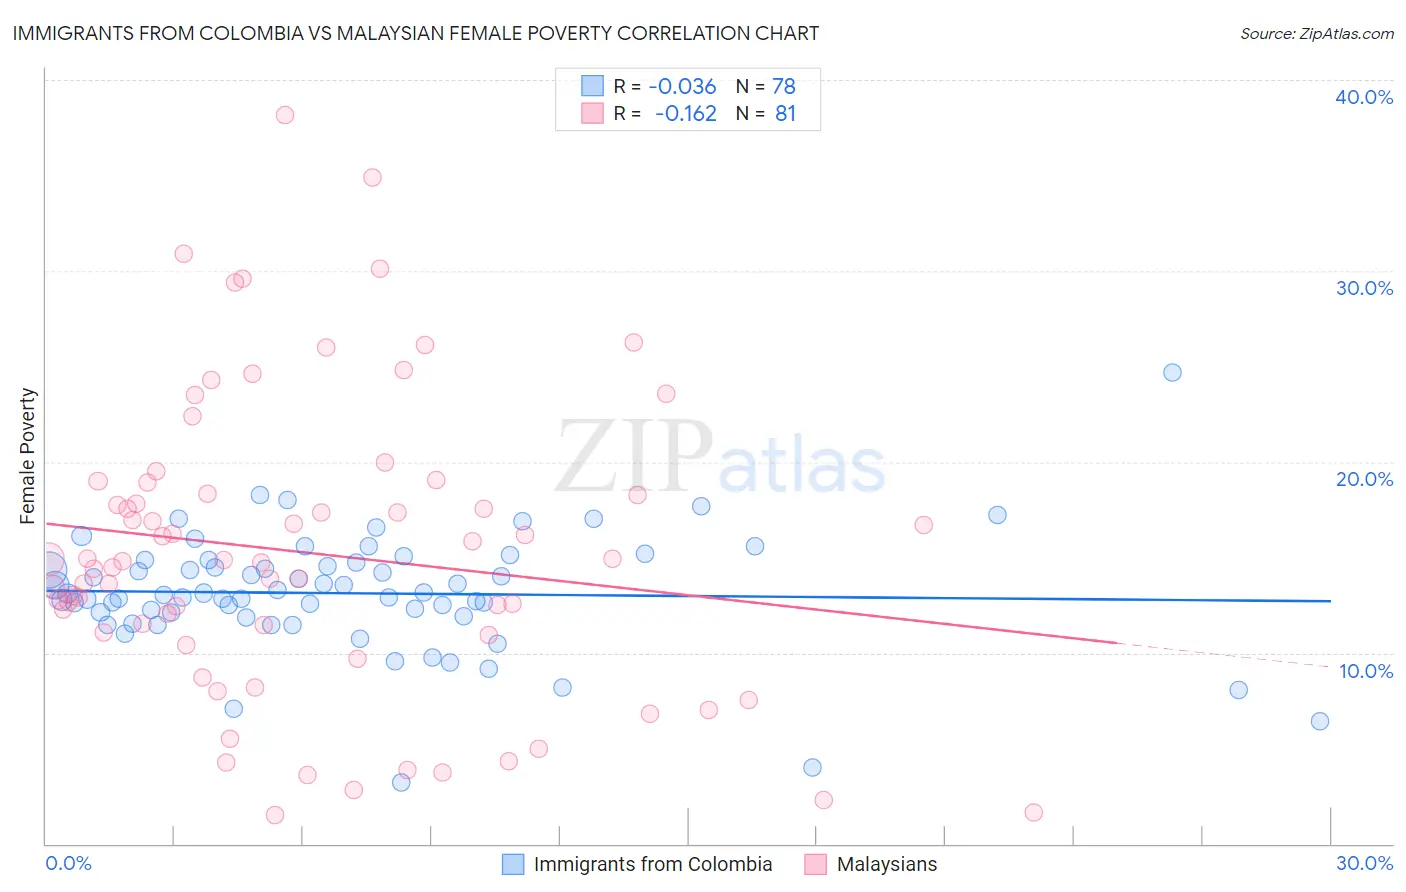
Immigrants from Colombia vs Malaysian Female Poverty Correlation Chart
The statistical analysis conducted on geographies consisting of 378,418,098 people shows no correlation between the proportion of Immigrants from Colombia and poverty level among females in the United States with a correlation coefficient (R) of -0.036 and weighted average of 13.5%. Similarly, the statistical analysis conducted on geographies consisting of 225,983,571 people shows a poor negative correlation between the proportion of Malaysians and poverty level among females in the United States with a correlation coefficient (R) of -0.162 and weighted average of 14.3%, a difference of 5.5%.
Female Poverty Correlation Summary
| Measurement | Immigrants from Colombia | Malaysian |
| Minimum | 3.2% | 1.5% |
| Maximum | 24.7% | 38.2% |
| Range | 21.5% | 36.7% |
| Mean | 13.1% | 15.2% |
| Median | 13.1% | 14.8% |
| Interquartile 25% (IQ1) | 11.9% | 11.0% |
| Interquartile 75% (IQ3) | 14.7% | 18.7% |
| Interquartile Range (IQR) | 2.8% | 7.6% |
| Standard Deviation (Sample) | 3.1% | 7.8% |
| Standard Deviation (Population) | 3.1% | 7.7% |
Similar Demographics by Female Poverty
Demographics Similar to Immigrants from Colombia by Female Poverty
In terms of female poverty, the demographic groups most similar to Immigrants from Colombia are Venezuelan (13.5%, a difference of 0.0%), South American (13.5%, a difference of 0.030%), Kenyan (13.5%, a difference of 0.070%), Immigrants from Sierra Leone (13.5%, a difference of 0.13%), and Immigrants from Cameroon (13.5%, a difference of 0.24%).
| Demographics | Rating | Rank | Female Poverty |
| Celtics | 49.9 /100 | #175 | Average 13.4% |
| Immigrants | Spain | 49.9 /100 | #176 | Average 13.4% |
| Immigrants | Morocco | 49.4 /100 | #177 | Average 13.4% |
| Israelis | 49.1 /100 | #178 | Average 13.5% |
| Immigrants | Syria | 48.8 /100 | #179 | Average 13.5% |
| South Americans | 44.8 /100 | #180 | Average 13.5% |
| Venezuelans | 44.5 /100 | #181 | Average 13.5% |
| Immigrants | Colombia | 44.5 /100 | #182 | Average 13.5% |
| Kenyans | 43.8 /100 | #183 | Average 13.5% |
| Immigrants | Sierra Leone | 43.2 /100 | #184 | Average 13.5% |
| Immigrants | Cameroon | 42.0 /100 | #185 | Average 13.5% |
| Immigrants | Portugal | 41.5 /100 | #186 | Average 13.6% |
| Immigrants | Venezuela | 41.0 /100 | #187 | Average 13.6% |
| Hawaiians | 39.9 /100 | #188 | Fair 13.6% |
| Uruguayans | 39.8 /100 | #189 | Fair 13.6% |
Demographics Similar to Malaysians by Female Poverty
In terms of female poverty, the demographic groups most similar to Malaysians are Panamanian (14.2%, a difference of 0.080%), Moroccan (14.3%, a difference of 0.080%), Immigrants from the Azores (14.2%, a difference of 0.15%), Immigrants from Eastern Africa (14.2%, a difference of 0.49%), and Bermudan (14.4%, a difference of 0.72%).
| Demographics | Rating | Rank | Female Poverty |
| Immigrants | Western Asia | 20.7 /100 | #203 | Fair 13.9% |
| Spaniards | 18.9 /100 | #204 | Poor 13.9% |
| Ugandans | 15.4 /100 | #205 | Poor 14.0% |
| Immigrants | Uruguay | 14.0 /100 | #206 | Poor 14.0% |
| Immigrants | Eastern Africa | 9.0 /100 | #207 | Tragic 14.2% |
| Immigrants | Azores | 7.9 /100 | #208 | Tragic 14.2% |
| Panamanians | 7.7 /100 | #209 | Tragic 14.2% |
| Malaysians | 7.4 /100 | #210 | Tragic 14.3% |
| Moroccans | 7.2 /100 | #211 | Tragic 14.3% |
| Bermudans | 5.5 /100 | #212 | Tragic 14.4% |
| Alaskan Athabascans | 5.3 /100 | #213 | Tragic 14.4% |
| Marshallese | 5.0 /100 | #214 | Tragic 14.4% |
| Immigrants | Panama | 4.7 /100 | #215 | Tragic 14.4% |
| Immigrants | Thailand | 4.5 /100 | #216 | Tragic 14.4% |
| Immigrants | Immigrants | 4.5 /100 | #217 | Tragic 14.4% |