Lithuanian vs Malaysian Receiving Food Stamps
COMPARE
Lithuanian
Malaysian
Receiving Food Stamps
Receiving Food Stamps Comparison
Lithuanians
Malaysians
9.7%
RECEIVING FOOD STAMPS
99.4/ 100
METRIC RATING
50th/ 347
METRIC RANK
12.7%
RECEIVING FOOD STAMPS
8.5/ 100
METRIC RATING
212th/ 347
METRIC RANK
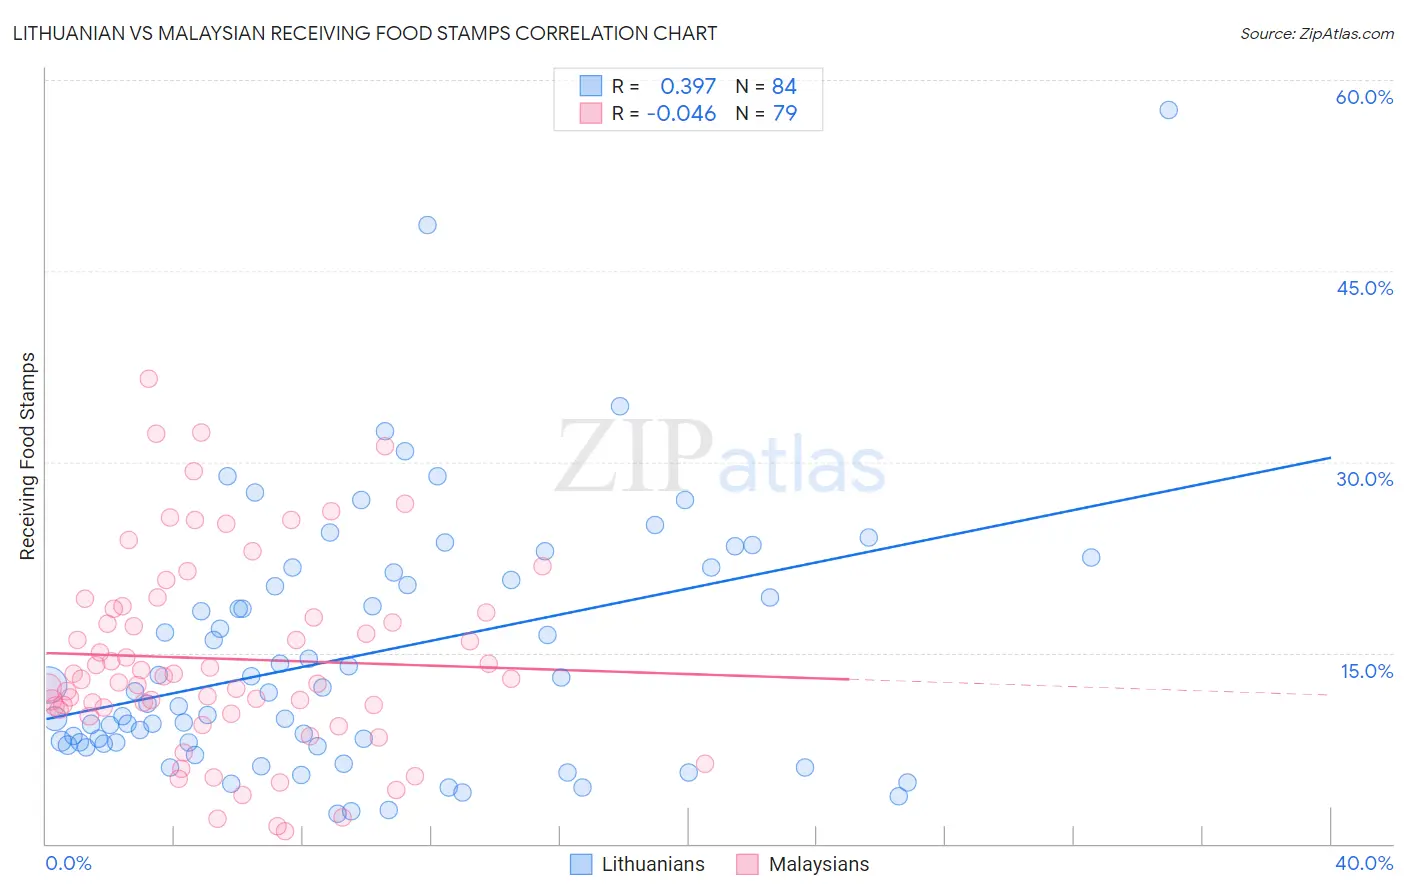
Lithuanian vs Malaysian Receiving Food Stamps Correlation Chart
The statistical analysis conducted on geographies consisting of 420,339,892 people shows a mild positive correlation between the proportion of Lithuanians and percentage of population receiving government assistance and/or food stamps in the United States with a correlation coefficient (R) of 0.397 and weighted average of 9.7%. Similarly, the statistical analysis conducted on geographies consisting of 225,895,632 people shows no correlation between the proportion of Malaysians and percentage of population receiving government assistance and/or food stamps in the United States with a correlation coefficient (R) of -0.046 and weighted average of 12.7%, a difference of 31.5%.
Receiving Food Stamps Correlation Summary
| Measurement | Lithuanian | Malaysian |
| Minimum | 2.4% | 1.0% |
| Maximum | 57.6% | 36.6% |
| Range | 55.2% | 35.6% |
| Mean | 14.8% | 14.5% |
| Median | 11.9% | 13.0% |
| Interquartile 25% (IQ1) | 7.9% | 10.5% |
| Interquartile 75% (IQ3) | 21.0% | 18.5% |
| Interquartile Range (IQR) | 13.1% | 8.0% |
| Standard Deviation (Sample) | 10.0% | 7.7% |
| Standard Deviation (Population) | 10.0% | 7.6% |
Similar Demographics by Receiving Food Stamps
Demographics Similar to Lithuanians by Receiving Food Stamps
In terms of receiving food stamps, the demographic groups most similar to Lithuanians are Asian (9.7%, a difference of 0.18%), Immigrants from South Africa (9.7%, a difference of 0.19%), Tongan (9.7%, a difference of 0.21%), Immigrants from Czechoslovakia (9.6%, a difference of 0.25%), and Russian (9.6%, a difference of 0.27%).
| Demographics | Rating | Rank | Receiving Food Stamps |
| Croatians | 99.5 /100 | #43 | Exceptional 9.6% |
| Immigrants | Denmark | 99.4 /100 | #44 | Exceptional 9.6% |
| Immigrants | Belgium | 99.4 /100 | #45 | Exceptional 9.6% |
| Australians | 99.4 /100 | #46 | Exceptional 9.6% |
| Indians (Asian) | 99.4 /100 | #47 | Exceptional 9.6% |
| Russians | 99.4 /100 | #48 | Exceptional 9.6% |
| Immigrants | Czechoslovakia | 99.4 /100 | #49 | Exceptional 9.6% |
| Lithuanians | 99.4 /100 | #50 | Exceptional 9.7% |
| Asians | 99.3 /100 | #51 | Exceptional 9.7% |
| Immigrants | South Africa | 99.3 /100 | #52 | Exceptional 9.7% |
| Tongans | 99.3 /100 | #53 | Exceptional 9.7% |
| Swiss | 99.3 /100 | #54 | Exceptional 9.7% |
| Immigrants | Switzerland | 99.3 /100 | #55 | Exceptional 9.7% |
| Immigrants | Canada | 99.3 /100 | #56 | Exceptional 9.7% |
| Greeks | 99.3 /100 | #57 | Exceptional 9.7% |
Demographics Similar to Malaysians by Receiving Food Stamps
In terms of receiving food stamps, the demographic groups most similar to Malaysians are Moroccan (12.8%, a difference of 0.40%), Immigrants from Africa (12.8%, a difference of 0.43%), Colombian (12.6%, a difference of 0.63%), Native Hawaiian (12.8%, a difference of 0.87%), and Immigrants from South America (12.8%, a difference of 0.98%).
| Demographics | Rating | Rank | Receiving Food Stamps |
| Aleuts | 17.3 /100 | #205 | Poor 12.4% |
| Immigrants | Thailand | 17.0 /100 | #206 | Poor 12.4% |
| South Americans | 16.0 /100 | #207 | Poor 12.4% |
| Potawatomi | 14.6 /100 | #208 | Poor 12.5% |
| Immigrants | Sierra Leone | 12.9 /100 | #209 | Poor 12.5% |
| Immigrants | Uruguay | 12.8 /100 | #210 | Poor 12.5% |
| Colombians | 10.2 /100 | #211 | Poor 12.6% |
| Malaysians | 8.5 /100 | #212 | Tragic 12.7% |
| Moroccans | 7.6 /100 | #213 | Tragic 12.8% |
| Immigrants | Africa | 7.6 /100 | #214 | Tragic 12.8% |
| Native Hawaiians | 6.7 /100 | #215 | Tragic 12.8% |
| Immigrants | South America | 6.5 /100 | #216 | Tragic 12.8% |
| Immigrants | Burma/Myanmar | 6.0 /100 | #217 | Tragic 12.9% |
| Hawaiians | 5.4 /100 | #218 | Tragic 12.9% |
| Immigrants | Middle Africa | 5.4 /100 | #219 | Tragic 12.9% |