Lithuanian vs German Russian Female Poverty
COMPARE
Lithuanian
German Russian
Female Poverty
Female Poverty Comparison
Lithuanians
German Russians
11.4%
FEMALE POVERTY
99.8/ 100
METRIC RATING
14th/ 347
METRIC RANK
14.7%
FEMALE POVERTY
2.0/ 100
METRIC RATING
228th/ 347
METRIC RANK
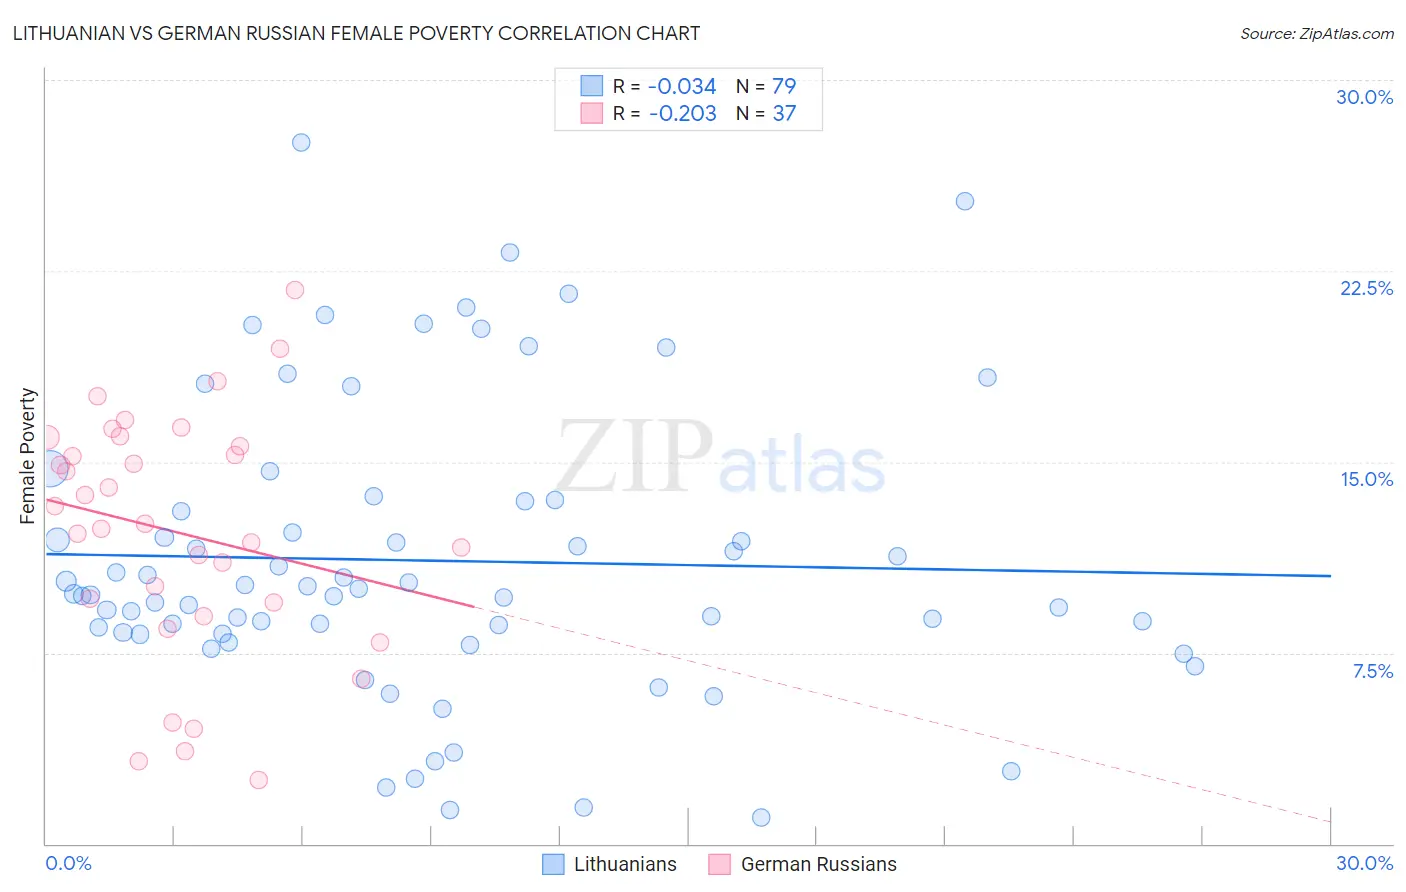
Lithuanian vs German Russian Female Poverty Correlation Chart
The statistical analysis conducted on geographies consisting of 421,598,229 people shows no correlation between the proportion of Lithuanians and poverty level among females in the United States with a correlation coefficient (R) of -0.034 and weighted average of 11.4%. Similarly, the statistical analysis conducted on geographies consisting of 96,439,432 people shows a weak negative correlation between the proportion of German Russians and poverty level among females in the United States with a correlation coefficient (R) of -0.203 and weighted average of 14.7%, a difference of 29.1%.
Female Poverty Correlation Summary
| Measurement | Lithuanian | German Russian |
| Minimum | 1.0% | 2.5% |
| Maximum | 27.5% | 21.7% |
| Range | 26.5% | 19.2% |
| Mean | 11.1% | 12.2% |
| Median | 9.8% | 12.6% |
| Interquartile 25% (IQ1) | 8.2% | 9.2% |
| Interquartile 75% (IQ3) | 13.5% | 15.8% |
| Interquartile Range (IQR) | 5.2% | 6.6% |
| Standard Deviation (Sample) | 5.7% | 4.7% |
| Standard Deviation (Population) | 5.6% | 4.7% |
Similar Demographics by Female Poverty
Demographics Similar to Lithuanians by Female Poverty
In terms of female poverty, the demographic groups most similar to Lithuanians are Latvian (11.4%, a difference of 0.32%), Immigrants from Bolivia (11.5%, a difference of 0.80%), Bolivian (11.5%, a difference of 0.87%), Immigrants from Scotland (11.5%, a difference of 0.92%), and Immigrants from Lithuania (11.3%, a difference of 0.96%).
| Demographics | Rating | Rank | Female Poverty |
| Assyrians/Chaldeans/Syriacs | 99.9 /100 | #7 | Exceptional 11.0% |
| Immigrants | South Central Asia | 99.9 /100 | #8 | Exceptional 11.1% |
| Bulgarians | 99.9 /100 | #9 | Exceptional 11.1% |
| Immigrants | Hong Kong | 99.9 /100 | #10 | Exceptional 11.2% |
| Maltese | 99.9 /100 | #11 | Exceptional 11.2% |
| Bhutanese | 99.9 /100 | #12 | Exceptional 11.3% |
| Immigrants | Lithuania | 99.9 /100 | #13 | Exceptional 11.3% |
| Lithuanians | 99.8 /100 | #14 | Exceptional 11.4% |
| Latvians | 99.8 /100 | #15 | Exceptional 11.4% |
| Immigrants | Bolivia | 99.8 /100 | #16 | Exceptional 11.5% |
| Bolivians | 99.8 /100 | #17 | Exceptional 11.5% |
| Immigrants | Scotland | 99.8 /100 | #18 | Exceptional 11.5% |
| Norwegians | 99.8 /100 | #19 | Exceptional 11.5% |
| Eastern Europeans | 99.7 /100 | #20 | Exceptional 11.5% |
| Italians | 99.7 /100 | #21 | Exceptional 11.6% |
Demographics Similar to German Russians by Female Poverty
In terms of female poverty, the demographic groups most similar to German Russians are Ghanaian (14.7%, a difference of 0.060%), Immigrants from Nigeria (14.7%, a difference of 0.15%), Alaska Native (14.7%, a difference of 0.27%), Nigerian (14.8%, a difference of 0.36%), and Immigrants from Eritrea (14.6%, a difference of 0.45%).
| Demographics | Rating | Rank | Female Poverty |
| Immigrants | Cambodia | 3.7 /100 | #221 | Tragic 14.5% |
| Immigrants | Nonimmigrants | 3.7 /100 | #222 | Tragic 14.5% |
| Immigrants | Africa | 3.3 /100 | #223 | Tragic 14.5% |
| Americans | 2.8 /100 | #224 | Tragic 14.6% |
| Immigrants | Micronesia | 2.8 /100 | #225 | Tragic 14.6% |
| Immigrants | Eritrea | 2.4 /100 | #226 | Tragic 14.6% |
| Immigrants | Nigeria | 2.1 /100 | #227 | Tragic 14.7% |
| German Russians | 2.0 /100 | #228 | Tragic 14.7% |
| Ghanaians | 1.9 /100 | #229 | Tragic 14.7% |
| Alaska Natives | 1.8 /100 | #230 | Tragic 14.7% |
| Nigerians | 1.7 /100 | #231 | Tragic 14.8% |
| Osage | 1.5 /100 | #232 | Tragic 14.8% |
| Immigrants | Saudi Arabia | 1.4 /100 | #233 | Tragic 14.8% |
| Fijians | 1.1 /100 | #234 | Tragic 14.9% |
| Immigrants | Laos | 0.9 /100 | #235 | Tragic 15.0% |