Lithuanian vs Immigrants from Liberia Receiving Food Stamps
COMPARE
Lithuanian
Immigrants from Liberia
Receiving Food Stamps
Receiving Food Stamps Comparison
Lithuanians
Immigrants from Liberia
9.7%
RECEIVING FOOD STAMPS
99.4/ 100
METRIC RATING
50th/ 347
METRIC RANK
15.1%
RECEIVING FOOD STAMPS
0.0/ 100
METRIC RATING
285th/ 347
METRIC RANK
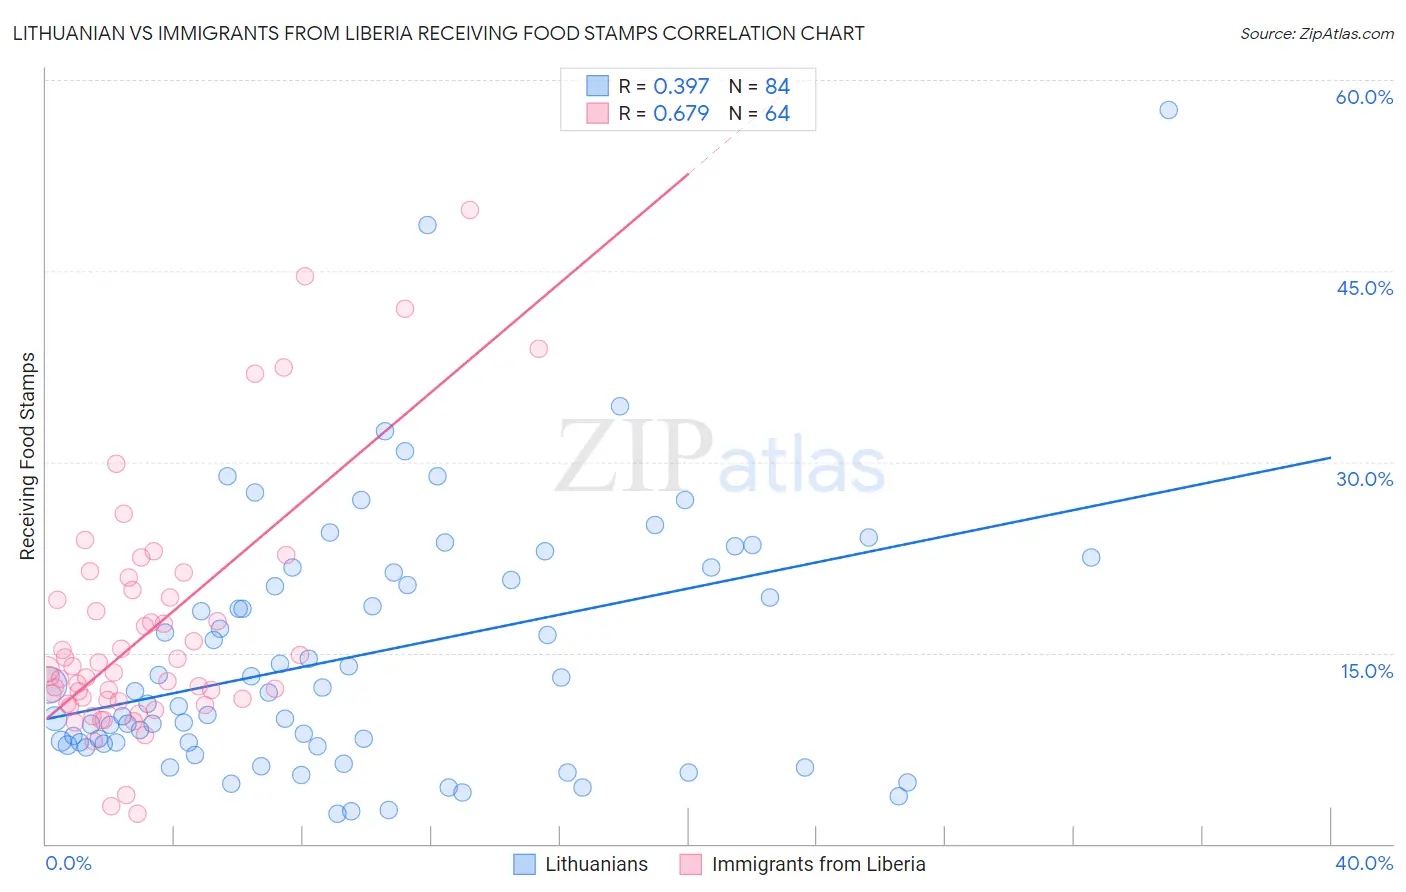
Lithuanian vs Immigrants from Liberia Receiving Food Stamps Correlation Chart
The statistical analysis conducted on geographies consisting of 420,339,892 people shows a mild positive correlation between the proportion of Lithuanians and percentage of population receiving government assistance and/or food stamps in the United States with a correlation coefficient (R) of 0.397 and weighted average of 9.7%. Similarly, the statistical analysis conducted on geographies consisting of 135,219,591 people shows a significant positive correlation between the proportion of Immigrants from Liberia and percentage of population receiving government assistance and/or food stamps in the United States with a correlation coefficient (R) of 0.679 and weighted average of 15.1%, a difference of 56.2%.
Receiving Food Stamps Correlation Summary
| Measurement | Lithuanian | Immigrants from Liberia |
| Minimum | 2.4% | 2.4% |
| Maximum | 57.6% | 49.8% |
| Range | 55.2% | 47.4% |
| Mean | 14.8% | 16.8% |
| Median | 11.9% | 13.6% |
| Interquartile 25% (IQ1) | 7.9% | 11.3% |
| Interquartile 75% (IQ3) | 21.0% | 19.6% |
| Interquartile Range (IQR) | 13.1% | 8.3% |
| Standard Deviation (Sample) | 10.0% | 9.6% |
| Standard Deviation (Population) | 10.0% | 9.6% |
Similar Demographics by Receiving Food Stamps
Demographics Similar to Lithuanians by Receiving Food Stamps
In terms of receiving food stamps, the demographic groups most similar to Lithuanians are Asian (9.7%, a difference of 0.18%), Immigrants from South Africa (9.7%, a difference of 0.19%), Tongan (9.7%, a difference of 0.21%), Immigrants from Czechoslovakia (9.6%, a difference of 0.25%), and Russian (9.6%, a difference of 0.27%).
| Demographics | Rating | Rank | Receiving Food Stamps |
| Croatians | 99.5 /100 | #43 | Exceptional 9.6% |
| Immigrants | Denmark | 99.4 /100 | #44 | Exceptional 9.6% |
| Immigrants | Belgium | 99.4 /100 | #45 | Exceptional 9.6% |
| Australians | 99.4 /100 | #46 | Exceptional 9.6% |
| Indians (Asian) | 99.4 /100 | #47 | Exceptional 9.6% |
| Russians | 99.4 /100 | #48 | Exceptional 9.6% |
| Immigrants | Czechoslovakia | 99.4 /100 | #49 | Exceptional 9.6% |
| Lithuanians | 99.4 /100 | #50 | Exceptional 9.7% |
| Asians | 99.3 /100 | #51 | Exceptional 9.7% |
| Immigrants | South Africa | 99.3 /100 | #52 | Exceptional 9.7% |
| Tongans | 99.3 /100 | #53 | Exceptional 9.7% |
| Swiss | 99.3 /100 | #54 | Exceptional 9.7% |
| Immigrants | Switzerland | 99.3 /100 | #55 | Exceptional 9.7% |
| Immigrants | Canada | 99.3 /100 | #56 | Exceptional 9.7% |
| Greeks | 99.3 /100 | #57 | Exceptional 9.7% |
Demographics Similar to Immigrants from Liberia by Receiving Food Stamps
In terms of receiving food stamps, the demographic groups most similar to Immigrants from Liberia are African (15.1%, a difference of 0.14%), Immigrants from Mexico (15.2%, a difference of 0.37%), Immigrants from Ecuador (15.0%, a difference of 0.38%), Bangladeshi (15.0%, a difference of 0.39%), and Immigrants from Central America (15.0%, a difference of 0.67%).
| Demographics | Rating | Rank | Receiving Food Stamps |
| Belizeans | 0.1 /100 | #278 | Tragic 14.8% |
| Kiowa | 0.0 /100 | #279 | Tragic 14.9% |
| Ecuadorians | 0.0 /100 | #280 | Tragic 14.9% |
| Spanish American Indians | 0.0 /100 | #281 | Tragic 14.9% |
| Immigrants | Central America | 0.0 /100 | #282 | Tragic 15.0% |
| Bangladeshis | 0.0 /100 | #283 | Tragic 15.0% |
| Immigrants | Ecuador | 0.0 /100 | #284 | Tragic 15.0% |
| Immigrants | Liberia | 0.0 /100 | #285 | Tragic 15.1% |
| Africans | 0.0 /100 | #286 | Tragic 15.1% |
| Immigrants | Mexico | 0.0 /100 | #287 | Tragic 15.2% |
| Immigrants | Belize | 0.0 /100 | #288 | Tragic 15.2% |
| Immigrants | Senegal | 0.0 /100 | #289 | Tragic 15.3% |
| Senegalese | 0.0 /100 | #290 | Tragic 15.4% |
| Hondurans | 0.0 /100 | #291 | Tragic 15.5% |
| Alaska Natives | 0.0 /100 | #292 | Tragic 15.6% |