Lithuanian vs Immigrants from Micronesia Female Unemployment
COMPARE
Lithuanian
Immigrants from Micronesia
Female Unemployment
Female Unemployment Comparison
Lithuanians
Immigrants from Micronesia
4.7%
FEMALE UNEMPLOYMENT
99.8/ 100
METRIC RATING
30th/ 347
METRIC RANK
5.2%
FEMALE UNEMPLOYMENT
66.9/ 100
METRIC RATING
159th/ 347
METRIC RANK
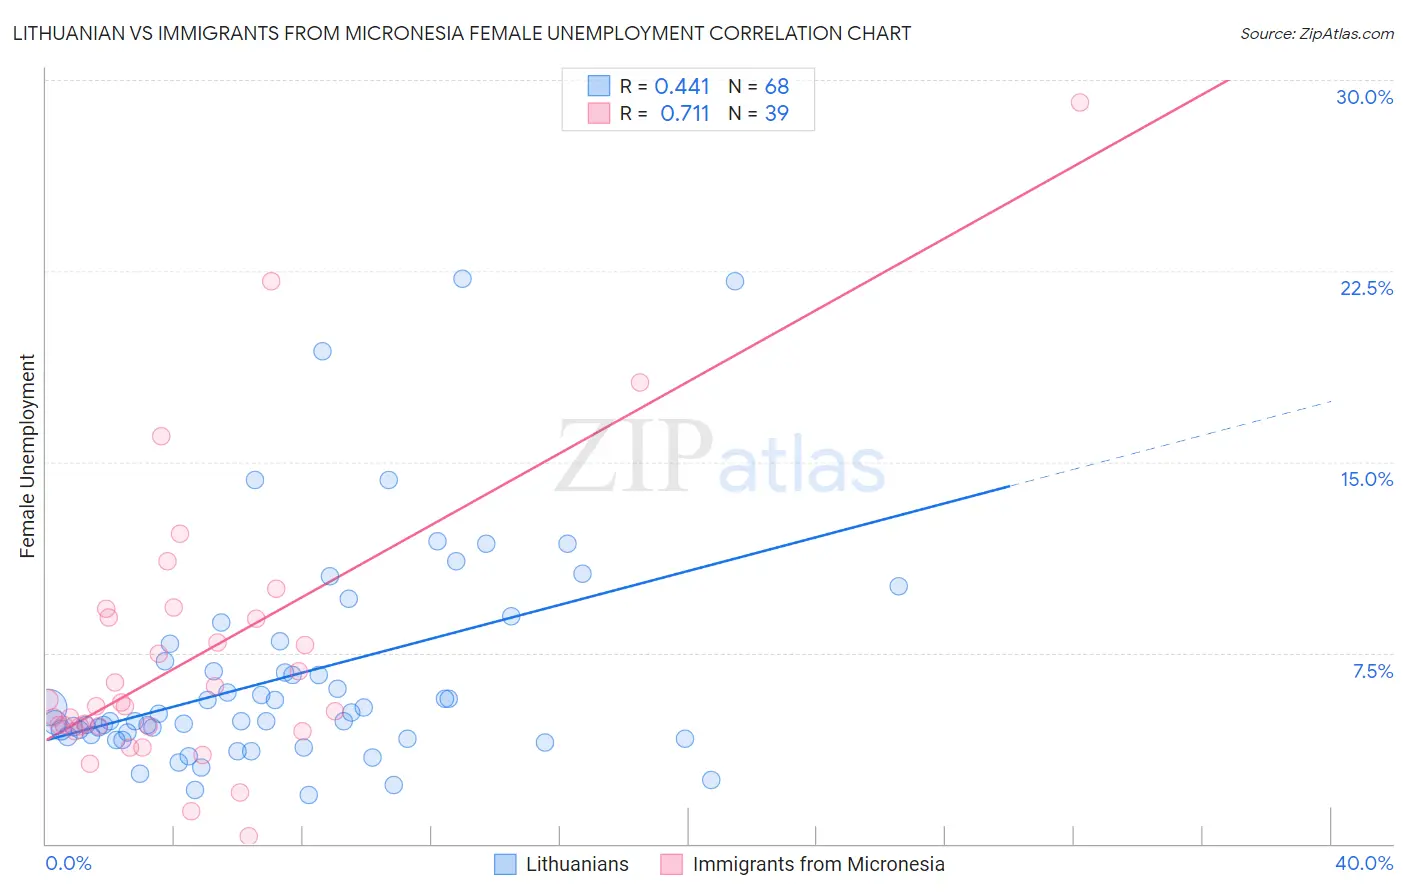
Lithuanian vs Immigrants from Micronesia Female Unemployment Correlation Chart
The statistical analysis conducted on geographies consisting of 418,507,146 people shows a moderate positive correlation between the proportion of Lithuanians and unemploymnet rate among females in the United States with a correlation coefficient (R) of 0.441 and weighted average of 4.7%. Similarly, the statistical analysis conducted on geographies consisting of 61,521,067 people shows a strong positive correlation between the proportion of Immigrants from Micronesia and unemploymnet rate among females in the United States with a correlation coefficient (R) of 0.711 and weighted average of 5.2%, a difference of 9.6%.
Female Unemployment Correlation Summary
| Measurement | Lithuanian | Immigrants from Micronesia |
| Minimum | 1.9% | 0.30% |
| Maximum | 22.2% | 29.1% |
| Range | 20.3% | 28.8% |
| Mean | 6.6% | 7.4% |
| Median | 4.8% | 5.4% |
| Interquartile 25% (IQ1) | 4.2% | 4.6% |
| Interquartile 75% (IQ3) | 7.5% | 8.9% |
| Interquartile Range (IQR) | 3.3% | 4.3% |
| Standard Deviation (Sample) | 4.3% | 5.6% |
| Standard Deviation (Population) | 4.2% | 5.6% |
Similar Demographics by Female Unemployment
Demographics Similar to Lithuanians by Female Unemployment
In terms of female unemployment, the demographic groups most similar to Lithuanians are Cypriot (4.7%, a difference of 0.12%), Irish (4.7%, a difference of 0.13%), British (4.7%, a difference of 0.16%), Sudanese (4.8%, a difference of 0.28%), and Immigrants from Bosnia and Herzegovina (4.7%, a difference of 0.33%).
| Demographics | Rating | Rank | Female Unemployment |
| Scottish | 99.9 /100 | #23 | Exceptional 4.7% |
| Welsh | 99.9 /100 | #24 | Exceptional 4.7% |
| Immigrants | India | 99.9 /100 | #25 | Exceptional 4.7% |
| Immigrants | Bosnia and Herzegovina | 99.9 /100 | #26 | Exceptional 4.7% |
| British | 99.9 /100 | #27 | Exceptional 4.7% |
| Irish | 99.9 /100 | #28 | Exceptional 4.7% |
| Cypriots | 99.9 /100 | #29 | Exceptional 4.7% |
| Lithuanians | 99.8 /100 | #30 | Exceptional 4.7% |
| Sudanese | 99.8 /100 | #31 | Exceptional 4.8% |
| Slovaks | 99.8 /100 | #32 | Exceptional 4.8% |
| Czechoslovakians | 99.7 /100 | #33 | Exceptional 4.8% |
| Zimbabweans | 99.7 /100 | #34 | Exceptional 4.8% |
| French Canadians | 99.7 /100 | #35 | Exceptional 4.8% |
| Yugoslavians | 99.7 /100 | #36 | Exceptional 4.8% |
| Pennsylvania Germans | 99.6 /100 | #37 | Exceptional 4.8% |
Demographics Similar to Immigrants from Micronesia by Female Unemployment
In terms of female unemployment, the demographic groups most similar to Immigrants from Micronesia are Immigrants from Spain (5.2%, a difference of 0.010%), Immigrants from Pakistan (5.2%, a difference of 0.010%), Potawatomi (5.2%, a difference of 0.070%), Albanian (5.2%, a difference of 0.10%), and Immigrants from Russia (5.2%, a difference of 0.17%).
| Demographics | Rating | Rank | Female Unemployment |
| Immigrants | Italy | 75.0 /100 | #152 | Good 5.2% |
| Immigrants | Greece | 74.9 /100 | #153 | Good 5.2% |
| South Africans | 70.8 /100 | #154 | Good 5.2% |
| Immigrants | Egypt | 70.0 /100 | #155 | Good 5.2% |
| Immigrants | Northern Africa | 69.6 /100 | #156 | Good 5.2% |
| Immigrants | Russia | 69.3 /100 | #157 | Good 5.2% |
| Albanians | 68.3 /100 | #158 | Good 5.2% |
| Immigrants | Micronesia | 66.9 /100 | #159 | Good 5.2% |
| Immigrants | Spain | 66.8 /100 | #160 | Good 5.2% |
| Immigrants | Pakistan | 66.7 /100 | #161 | Good 5.2% |
| Potawatomi | 65.9 /100 | #162 | Good 5.2% |
| Immigrants | Asia | 64.3 /100 | #163 | Good 5.2% |
| Bangladeshis | 64.3 /100 | #164 | Good 5.2% |
| Syrians | 62.8 /100 | #165 | Good 5.2% |
| Native Hawaiians | 62.7 /100 | #166 | Good 5.2% |