Lithuanian vs Immigrants from Congo Receiving Food Stamps
COMPARE
Lithuanian
Immigrants from Congo
Receiving Food Stamps
Receiving Food Stamps Comparison
Lithuanians
Immigrants from Congo
9.7%
RECEIVING FOOD STAMPS
99.4/ 100
METRIC RATING
50th/ 347
METRIC RANK
14.1%
RECEIVING FOOD STAMPS
0.3/ 100
METRIC RATING
261st/ 347
METRIC RANK
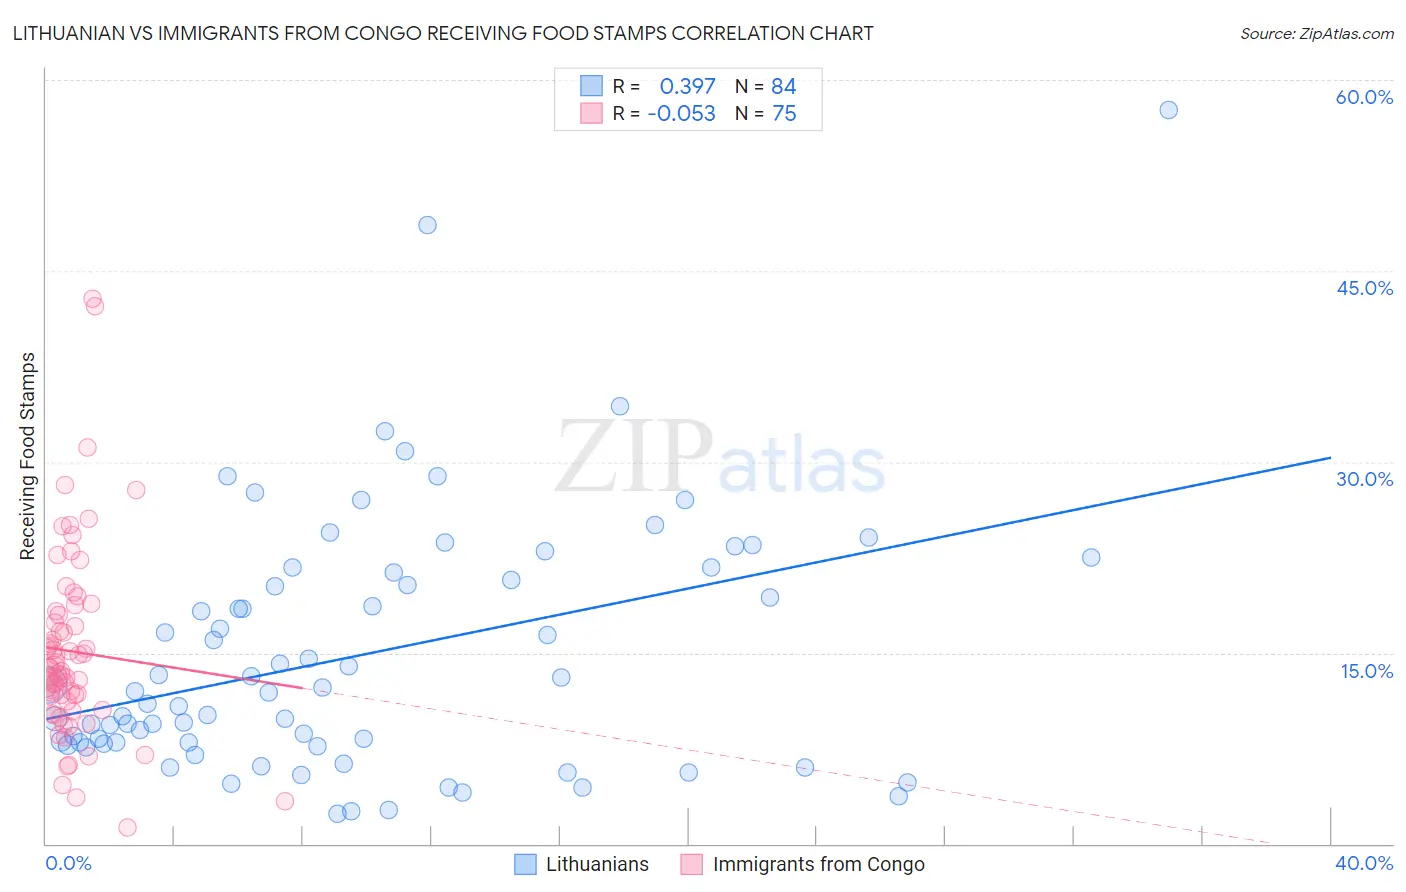
Lithuanian vs Immigrants from Congo Receiving Food Stamps Correlation Chart
The statistical analysis conducted on geographies consisting of 420,339,892 people shows a mild positive correlation between the proportion of Lithuanians and percentage of population receiving government assistance and/or food stamps in the United States with a correlation coefficient (R) of 0.397 and weighted average of 9.7%. Similarly, the statistical analysis conducted on geographies consisting of 92,058,964 people shows a slight negative correlation between the proportion of Immigrants from Congo and percentage of population receiving government assistance and/or food stamps in the United States with a correlation coefficient (R) of -0.053 and weighted average of 14.1%, a difference of 46.4%.
Receiving Food Stamps Correlation Summary
| Measurement | Lithuanian | Immigrants from Congo |
| Minimum | 2.4% | 1.3% |
| Maximum | 57.6% | 42.8% |
| Range | 55.2% | 41.5% |
| Mean | 14.8% | 15.1% |
| Median | 11.9% | 13.5% |
| Interquartile 25% (IQ1) | 7.9% | 11.2% |
| Interquartile 75% (IQ3) | 21.0% | 18.0% |
| Interquartile Range (IQR) | 13.1% | 6.8% |
| Standard Deviation (Sample) | 10.0% | 7.4% |
| Standard Deviation (Population) | 10.0% | 7.4% |
Similar Demographics by Receiving Food Stamps
Demographics Similar to Lithuanians by Receiving Food Stamps
In terms of receiving food stamps, the demographic groups most similar to Lithuanians are Asian (9.7%, a difference of 0.18%), Immigrants from South Africa (9.7%, a difference of 0.19%), Tongan (9.7%, a difference of 0.21%), Immigrants from Czechoslovakia (9.6%, a difference of 0.25%), and Russian (9.6%, a difference of 0.27%).
| Demographics | Rating | Rank | Receiving Food Stamps |
| Croatians | 99.5 /100 | #43 | Exceptional 9.6% |
| Immigrants | Denmark | 99.4 /100 | #44 | Exceptional 9.6% |
| Immigrants | Belgium | 99.4 /100 | #45 | Exceptional 9.6% |
| Australians | 99.4 /100 | #46 | Exceptional 9.6% |
| Indians (Asian) | 99.4 /100 | #47 | Exceptional 9.6% |
| Russians | 99.4 /100 | #48 | Exceptional 9.6% |
| Immigrants | Czechoslovakia | 99.4 /100 | #49 | Exceptional 9.6% |
| Lithuanians | 99.4 /100 | #50 | Exceptional 9.7% |
| Asians | 99.3 /100 | #51 | Exceptional 9.7% |
| Immigrants | South Africa | 99.3 /100 | #52 | Exceptional 9.7% |
| Tongans | 99.3 /100 | #53 | Exceptional 9.7% |
| Swiss | 99.3 /100 | #54 | Exceptional 9.7% |
| Immigrants | Switzerland | 99.3 /100 | #55 | Exceptional 9.7% |
| Immigrants | Canada | 99.3 /100 | #56 | Exceptional 9.7% |
| Greeks | 99.3 /100 | #57 | Exceptional 9.7% |
Demographics Similar to Immigrants from Congo by Receiving Food Stamps
In terms of receiving food stamps, the demographic groups most similar to Immigrants from Congo are Central American (14.1%, a difference of 0.010%), Creek (14.1%, a difference of 0.11%), Immigrants from Ghana (14.1%, a difference of 0.23%), Arapaho (14.1%, a difference of 0.31%), and Japanese (14.1%, a difference of 0.41%).
| Demographics | Rating | Rank | Receiving Food Stamps |
| Marshallese | 0.3 /100 | #254 | Tragic 14.1% |
| Sub-Saharan Africans | 0.3 /100 | #255 | Tragic 14.1% |
| Japanese | 0.3 /100 | #256 | Tragic 14.1% |
| Arapaho | 0.3 /100 | #257 | Tragic 14.1% |
| Immigrants | Ghana | 0.3 /100 | #258 | Tragic 14.1% |
| Creek | 0.3 /100 | #259 | Tragic 14.1% |
| Central Americans | 0.3 /100 | #260 | Tragic 14.1% |
| Immigrants | Congo | 0.3 /100 | #261 | Tragic 14.1% |
| Paiute | 0.2 /100 | #262 | Tragic 14.3% |
| Immigrants | Portugal | 0.2 /100 | #263 | Tragic 14.3% |
| Immigrants | Uzbekistan | 0.2 /100 | #264 | Tragic 14.3% |
| Blackfeet | 0.2 /100 | #265 | Tragic 14.3% |
| Cheyenne | 0.2 /100 | #266 | Tragic 14.3% |
| Dutch West Indians | 0.2 /100 | #267 | Tragic 14.3% |
| Guatemalans | 0.1 /100 | #268 | Tragic 14.4% |