Lithuanian vs Immigrants from Micronesia High School Diploma
COMPARE
Lithuanian
Immigrants from Micronesia
High School Diploma
High School Diploma Comparison
Lithuanians
Immigrants from Micronesia
92.0%
HIGH SCHOOL DIPLOMA
100.0/ 100
METRIC RATING
4th/ 347
METRIC RANK
88.6%
HIGH SCHOOL DIPLOMA
16.4/ 100
METRIC RATING
205th/ 347
METRIC RANK
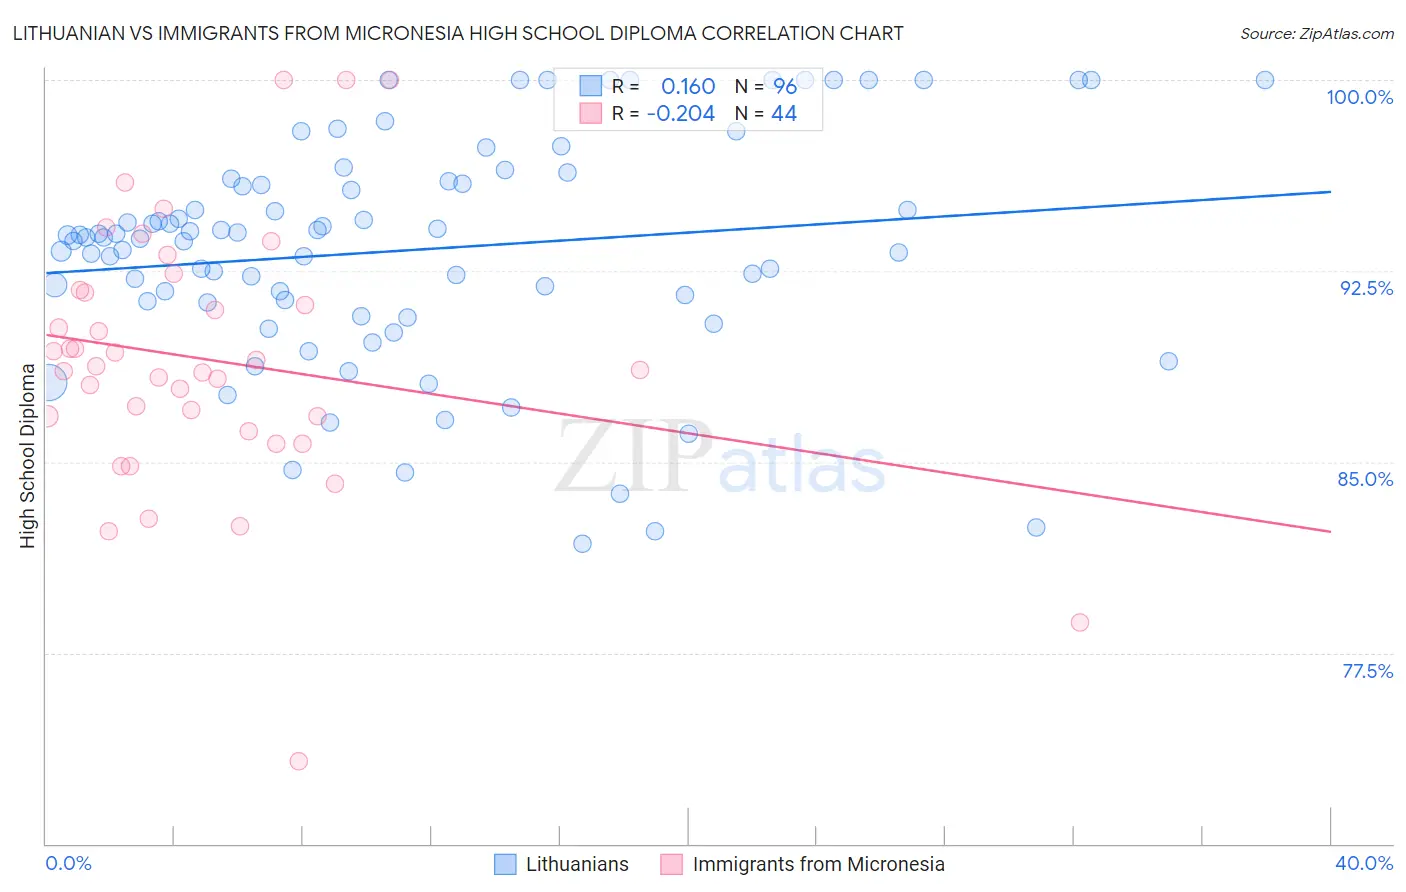
Lithuanian vs Immigrants from Micronesia High School Diploma Correlation Chart
The statistical analysis conducted on geographies consisting of 421,947,832 people shows a poor positive correlation between the proportion of Lithuanians and percentage of population with at least high school diploma education in the United States with a correlation coefficient (R) of 0.160 and weighted average of 92.0%. Similarly, the statistical analysis conducted on geographies consisting of 61,609,499 people shows a weak negative correlation between the proportion of Immigrants from Micronesia and percentage of population with at least high school diploma education in the United States with a correlation coefficient (R) of -0.204 and weighted average of 88.6%, a difference of 3.9%.
High School Diploma Correlation Summary
| Measurement | Lithuanian | Immigrants from Micronesia |
| Minimum | 81.8% | 73.2% |
| Maximum | 100.0% | 100.0% |
| Range | 18.2% | 26.8% |
| Mean | 93.3% | 89.0% |
| Median | 93.8% | 88.7% |
| Interquartile 25% (IQ1) | 91.3% | 86.5% |
| Interquartile 75% (IQ3) | 96.0% | 91.7% |
| Interquartile Range (IQR) | 4.7% | 5.2% |
| Standard Deviation (Sample) | 4.4% | 5.2% |
| Standard Deviation (Population) | 4.4% | 5.1% |
Similar Demographics by High School Diploma
Demographics Similar to Lithuanians by High School Diploma
In terms of high school diploma, the demographic groups most similar to Lithuanians are Slovene (92.0%, a difference of 0.0%), Slovak (92.0%, a difference of 0.030%), Immigrants from India (92.0%, a difference of 0.030%), Chinese (92.0%, a difference of 0.040%), and Latvian (92.0%, a difference of 0.050%).
| Demographics | Rating | Rank | High School Diploma |
| Norwegians | 100.0 /100 | #1 | Exceptional 92.5% |
| Swedes | 100.0 /100 | #2 | Exceptional 92.2% |
| Carpatho Rusyns | 100.0 /100 | #3 | Exceptional 92.1% |
| Lithuanians | 100.0 /100 | #4 | Exceptional 92.0% |
| Slovenes | 100.0 /100 | #5 | Exceptional 92.0% |
| Slovaks | 100.0 /100 | #6 | Exceptional 92.0% |
| Immigrants | India | 100.0 /100 | #7 | Exceptional 92.0% |
| Chinese | 100.0 /100 | #8 | Exceptional 92.0% |
| Latvians | 100.0 /100 | #9 | Exceptional 92.0% |
| Croatians | 100.0 /100 | #10 | Exceptional 92.0% |
| Eastern Europeans | 100.0 /100 | #11 | Exceptional 91.9% |
| Poles | 100.0 /100 | #12 | Exceptional 91.9% |
| Danes | 100.0 /100 | #13 | Exceptional 91.8% |
| Bulgarians | 100.0 /100 | #14 | Exceptional 91.8% |
| Luxembourgers | 100.0 /100 | #15 | Exceptional 91.7% |
Demographics Similar to Immigrants from Micronesia by High School Diploma
In terms of high school diploma, the demographic groups most similar to Immigrants from Micronesia are Arapaho (88.6%, a difference of 0.010%), Armenian (88.6%, a difference of 0.020%), Immigrants from Sierra Leone (88.6%, a difference of 0.020%), Somali (88.6%, a difference of 0.030%), and Panamanian (88.6%, a difference of 0.040%).
| Demographics | Rating | Rank | High School Diploma |
| Liberians | 18.8 /100 | #198 | Poor 88.7% |
| Marshallese | 18.7 /100 | #199 | Poor 88.6% |
| Hawaiians | 18.3 /100 | #200 | Poor 88.6% |
| Koreans | 18.1 /100 | #201 | Poor 88.6% |
| Panamanians | 18.0 /100 | #202 | Poor 88.6% |
| Somalis | 17.5 /100 | #203 | Poor 88.6% |
| Armenians | 17.2 /100 | #204 | Poor 88.6% |
| Immigrants | Micronesia | 16.4 /100 | #205 | Poor 88.6% |
| Arapaho | 16.1 /100 | #206 | Poor 88.6% |
| Immigrants | Sierra Leone | 15.8 /100 | #207 | Poor 88.6% |
| Portuguese | 14.4 /100 | #208 | Poor 88.5% |
| Cherokee | 14.3 /100 | #209 | Poor 88.5% |
| Samoans | 14.0 /100 | #210 | Poor 88.5% |
| Inupiat | 13.1 /100 | #211 | Poor 88.5% |
| South American Indians | 12.2 /100 | #212 | Poor 88.5% |