Liberian vs Egyptian Receiving Food Stamps
COMPARE
Liberian
Egyptian
Receiving Food Stamps
Receiving Food Stamps Comparison
Liberians
Egyptians
14.8%
RECEIVING FOOD STAMPS
0.1/ 100
METRIC RATING
276th/ 347
METRIC RANK
10.0%
RECEIVING FOOD STAMPS
98.4/ 100
METRIC RATING
87th/ 347
METRIC RANK
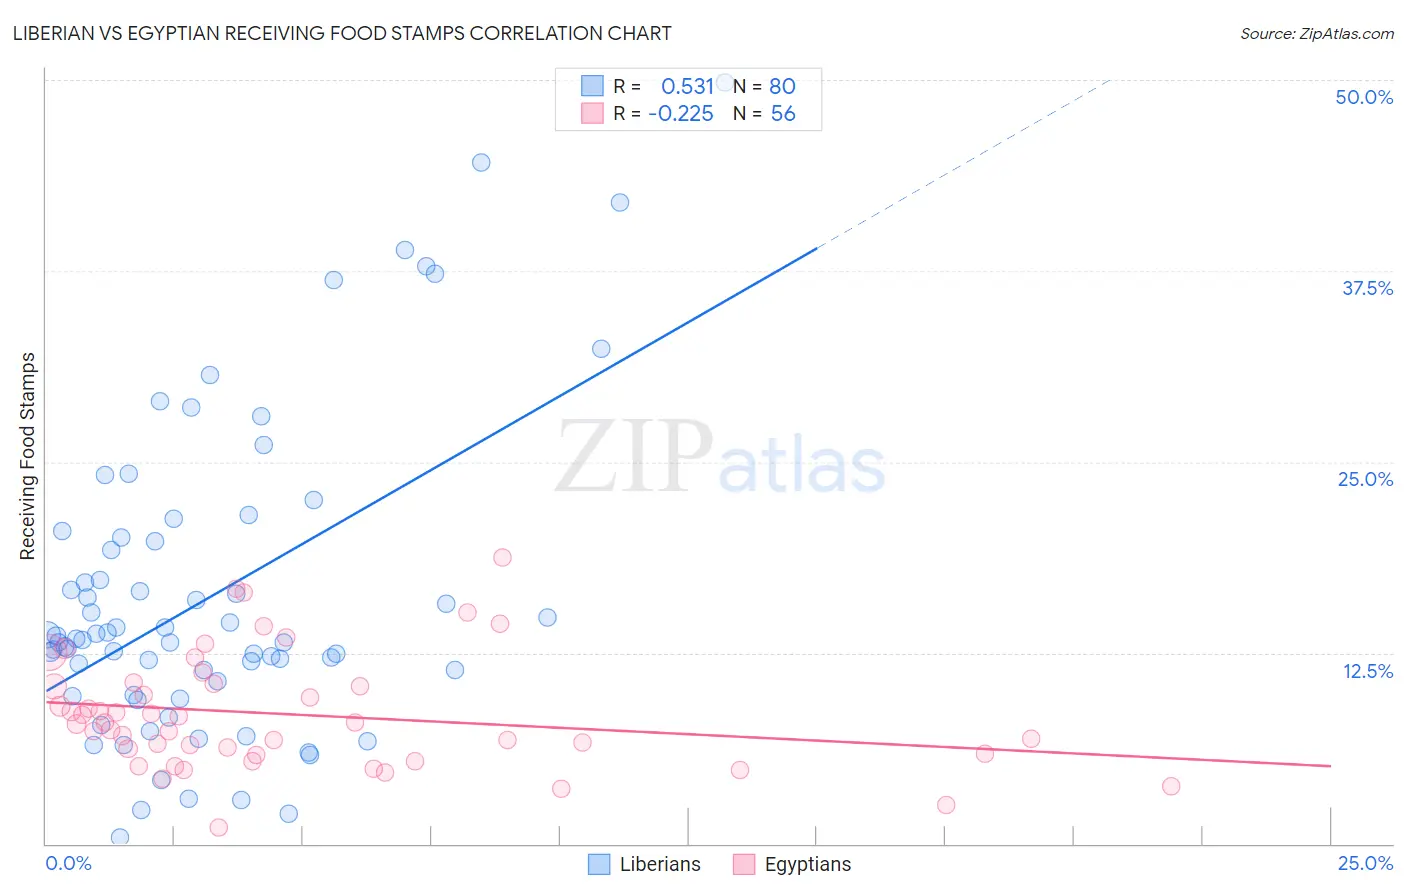
Liberian vs Egyptian Receiving Food Stamps Correlation Chart
The statistical analysis conducted on geographies consisting of 118,008,708 people shows a substantial positive correlation between the proportion of Liberians and percentage of population receiving government assistance and/or food stamps in the United States with a correlation coefficient (R) of 0.531 and weighted average of 14.8%. Similarly, the statistical analysis conducted on geographies consisting of 276,302,690 people shows a weak negative correlation between the proportion of Egyptians and percentage of population receiving government assistance and/or food stamps in the United States with a correlation coefficient (R) of -0.225 and weighted average of 10.0%, a difference of 47.4%.
Receiving Food Stamps Correlation Summary
| Measurement | Liberian | Egyptian |
| Minimum | 0.40% | 1.1% |
| Maximum | 49.8% | 18.7% |
| Range | 49.4% | 17.6% |
| Mean | 16.2% | 8.5% |
| Median | 13.4% | 7.9% |
| Interquartile 25% (IQ1) | 10.2% | 5.9% |
| Interquartile 75% (IQ3) | 19.9% | 10.4% |
| Interquartile Range (IQR) | 9.7% | 4.5% |
| Standard Deviation (Sample) | 10.3% | 3.7% |
| Standard Deviation (Population) | 10.2% | 3.7% |
Similar Demographics by Receiving Food Stamps
Demographics Similar to Liberians by Receiving Food Stamps
In terms of receiving food stamps, the demographic groups most similar to Liberians are Seminole (14.8%, a difference of 0.050%), Belizean (14.8%, a difference of 0.18%), Kiowa (14.9%, a difference of 0.45%), Ecuadorian (14.9%, a difference of 0.50%), and Ute (14.7%, a difference of 0.71%).
| Demographics | Rating | Rank | Receiving Food Stamps |
| Nepalese | 0.1 /100 | #269 | Tragic 14.6% |
| Mexicans | 0.1 /100 | #270 | Tragic 14.6% |
| Immigrants | Guatemala | 0.1 /100 | #271 | Tragic 14.6% |
| Chippewa | 0.1 /100 | #272 | Tragic 14.7% |
| Alaskan Athabascans | 0.1 /100 | #273 | Tragic 14.7% |
| Immigrants | Western Africa | 0.1 /100 | #274 | Tragic 14.7% |
| Ute | 0.1 /100 | #275 | Tragic 14.7% |
| Liberians | 0.1 /100 | #276 | Tragic 14.8% |
| Seminole | 0.1 /100 | #277 | Tragic 14.8% |
| Belizeans | 0.1 /100 | #278 | Tragic 14.8% |
| Kiowa | 0.0 /100 | #279 | Tragic 14.9% |
| Ecuadorians | 0.0 /100 | #280 | Tragic 14.9% |
| Spanish American Indians | 0.0 /100 | #281 | Tragic 14.9% |
| Immigrants | Central America | 0.0 /100 | #282 | Tragic 15.0% |
| Bangladeshis | 0.0 /100 | #283 | Tragic 15.0% |
Demographics Similar to Egyptians by Receiving Food Stamps
In terms of receiving food stamps, the demographic groups most similar to Egyptians are Immigrants from Norway (10.0%, a difference of 0.030%), Immigrants from Kuwait (10.0%, a difference of 0.060%), Immigrants from Romania (10.0%, a difference of 0.13%), Immigrants from Israel (10.0%, a difference of 0.31%), and Immigrants from France (10.1%, a difference of 0.31%).
| Demographics | Rating | Rank | Receiving Food Stamps |
| Poles | 98.6 /100 | #80 | Exceptional 10.0% |
| Immigrants | England | 98.6 /100 | #81 | Exceptional 10.0% |
| Austrians | 98.6 /100 | #82 | Exceptional 10.0% |
| Dutch | 98.6 /100 | #83 | Exceptional 10.0% |
| Immigrants | Israel | 98.5 /100 | #84 | Exceptional 10.0% |
| Immigrants | Romania | 98.5 /100 | #85 | Exceptional 10.0% |
| Immigrants | Norway | 98.4 /100 | #86 | Exceptional 10.0% |
| Egyptians | 98.4 /100 | #87 | Exceptional 10.0% |
| Immigrants | Kuwait | 98.4 /100 | #88 | Exceptional 10.0% |
| Immigrants | France | 98.3 /100 | #89 | Exceptional 10.1% |
| Finns | 97.9 /100 | #90 | Exceptional 10.2% |
| Jordanians | 97.9 /100 | #91 | Exceptional 10.2% |
| Irish | 97.9 /100 | #92 | Exceptional 10.2% |
| Belgians | 97.7 /100 | #93 | Exceptional 10.2% |
| Immigrants | Greece | 97.4 /100 | #94 | Exceptional 10.3% |