Bangladeshi vs Immigrants from Burma/Myanmar Single Mother Poverty
COMPARE
Bangladeshi
Immigrants from Burma/Myanmar
Single Mother Poverty
Single Mother Poverty Comparison
Bangladeshis
Immigrants from Burma/Myanmar
31.7%
SINGLE MOTHER POVERTY
0.1/ 100
METRIC RATING
274th/ 347
METRIC RANK
30.6%
SINGLE MOTHER POVERTY
1.7/ 100
METRIC RATING
242nd/ 347
METRIC RANK
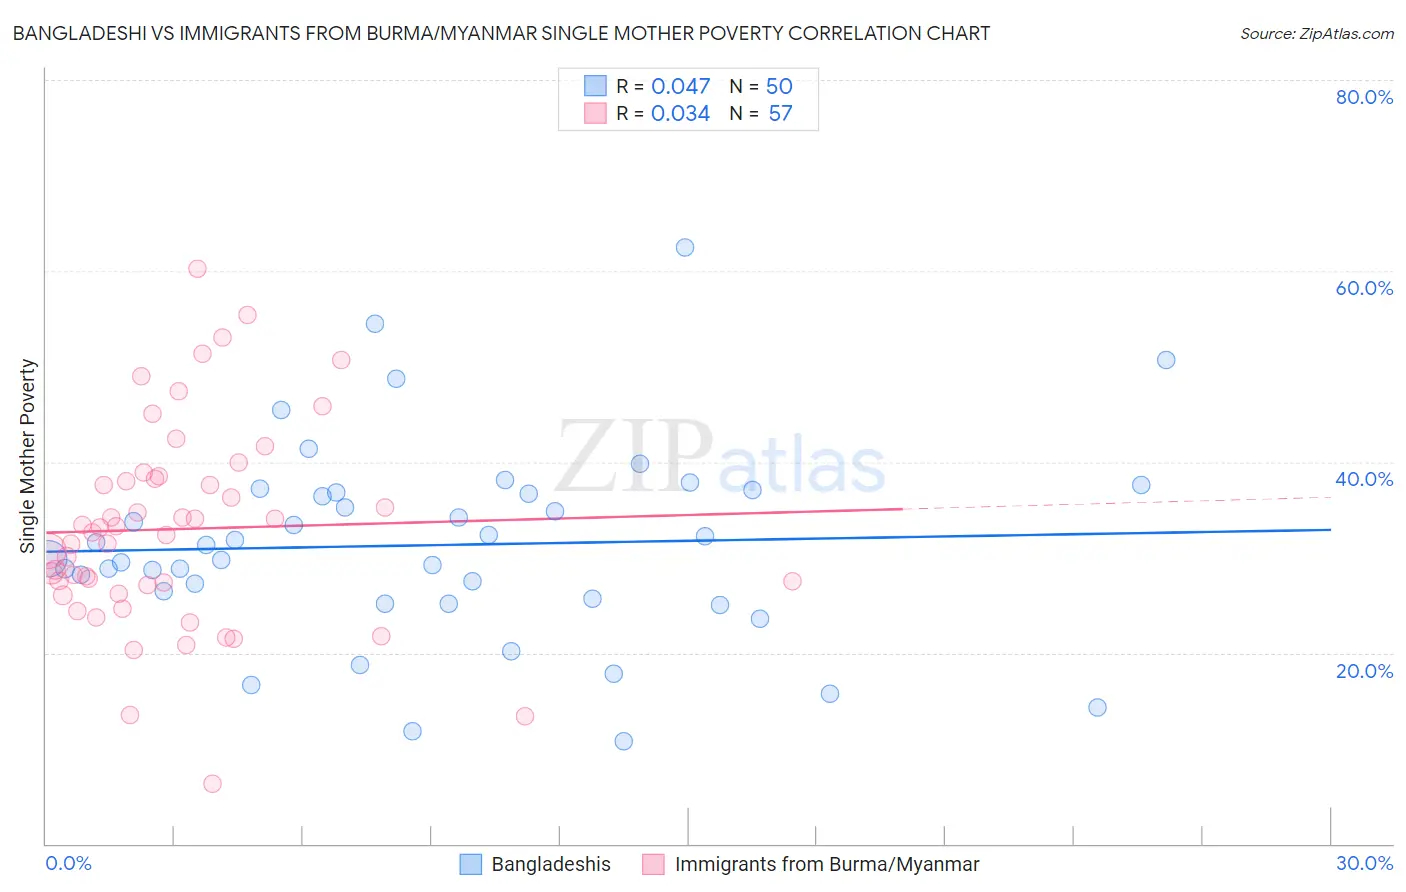
Bangladeshi vs Immigrants from Burma/Myanmar Single Mother Poverty Correlation Chart
The statistical analysis conducted on geographies consisting of 140,162,817 people shows no correlation between the proportion of Bangladeshis and poverty level among single mothers in the United States with a correlation coefficient (R) of 0.047 and weighted average of 31.7%. Similarly, the statistical analysis conducted on geographies consisting of 170,565,038 people shows no correlation between the proportion of Immigrants from Burma/Myanmar and poverty level among single mothers in the United States with a correlation coefficient (R) of 0.034 and weighted average of 30.6%, a difference of 3.7%.
Single Mother Poverty Correlation Summary
| Measurement | Bangladeshi | Immigrants from Burma/Myanmar |
| Minimum | 10.8% | 6.2% |
| Maximum | 62.5% | 60.3% |
| Range | 51.7% | 54.0% |
| Mean | 31.3% | 33.0% |
| Median | 30.5% | 32.7% |
| Interquartile 25% (IQ1) | 25.7% | 26.6% |
| Interquartile 75% (IQ3) | 36.8% | 38.3% |
| Interquartile Range (IQR) | 11.1% | 11.7% |
| Standard Deviation (Sample) | 10.3% | 10.6% |
| Standard Deviation (Population) | 10.2% | 10.5% |
Similar Demographics by Single Mother Poverty
Demographics Similar to Bangladeshis by Single Mother Poverty
In terms of single mother poverty, the demographic groups most similar to Bangladeshis are Central American (31.8%, a difference of 0.19%), Fijian (31.6%, a difference of 0.23%), Delaware (31.8%, a difference of 0.35%), Immigrants from Micronesia (31.6%, a difference of 0.46%), and Immigrants from Cabo Verde (31.6%, a difference of 0.48%).
| Demographics | Rating | Rank | Single Mother Poverty |
| Immigrants | Belize | 0.2 /100 | #267 | Tragic 31.4% |
| Immigrants | Senegal | 0.1 /100 | #268 | Tragic 31.5% |
| Scotch-Irish | 0.1 /100 | #269 | Tragic 31.5% |
| British West Indians | 0.1 /100 | #270 | Tragic 31.5% |
| Immigrants | Cabo Verde | 0.1 /100 | #271 | Tragic 31.6% |
| Immigrants | Micronesia | 0.1 /100 | #272 | Tragic 31.6% |
| Fijians | 0.1 /100 | #273 | Tragic 31.6% |
| Bangladeshis | 0.1 /100 | #274 | Tragic 31.7% |
| Central Americans | 0.1 /100 | #275 | Tragic 31.8% |
| Delaware | 0.0 /100 | #276 | Tragic 31.8% |
| Mexican American Indians | 0.0 /100 | #277 | Tragic 31.9% |
| Immigrants | Zaire | 0.0 /100 | #278 | Tragic 32.0% |
| Marshallese | 0.0 /100 | #279 | Tragic 32.1% |
| Immigrants | Nonimmigrants | 0.0 /100 | #280 | Tragic 32.2% |
| Cree | 0.0 /100 | #281 | Tragic 32.2% |
Demographics Similar to Immigrants from Burma/Myanmar by Single Mother Poverty
In terms of single mother poverty, the demographic groups most similar to Immigrants from Burma/Myanmar are Immigrants from Laos (30.6%, a difference of 0.020%), Salvadoran (30.6%, a difference of 0.070%), Bermudan (30.6%, a difference of 0.080%), Immigrants from Portugal (30.5%, a difference of 0.20%), and French (30.7%, a difference of 0.30%).
| Demographics | Rating | Rank | Single Mother Poverty |
| Immigrants | Grenada | 3.4 /100 | #235 | Tragic 30.3% |
| Welsh | 3.2 /100 | #236 | Tragic 30.4% |
| Immigrants | St. Vincent and the Grenadines | 3.1 /100 | #237 | Tragic 30.4% |
| Slovaks | 2.8 /100 | #238 | Tragic 30.4% |
| Immigrants | Portugal | 2.1 /100 | #239 | Tragic 30.5% |
| Salvadorans | 1.8 /100 | #240 | Tragic 30.6% |
| Immigrants | Laos | 1.8 /100 | #241 | Tragic 30.6% |
| Immigrants | Burma/Myanmar | 1.7 /100 | #242 | Tragic 30.6% |
| Bermudans | 1.6 /100 | #243 | Tragic 30.6% |
| French | 1.3 /100 | #244 | Tragic 30.7% |
| Barbadians | 1.3 /100 | #245 | Tragic 30.7% |
| Ecuadorians | 0.9 /100 | #246 | Tragic 30.8% |
| West Indians | 0.9 /100 | #247 | Tragic 30.8% |
| French Canadians | 0.9 /100 | #248 | Tragic 30.8% |
| Cape Verdeans | 0.8 /100 | #249 | Tragic 30.8% |