Liberian vs Immigrants from France Single Father Poverty
COMPARE
Liberian
Immigrants from France
Single Father Poverty
Single Father Poverty Comparison
Liberians
Immigrants from France
16.0%
SINGLE FATHER POVERTY
83.3/ 100
METRIC RATING
141st/ 347
METRIC RANK
16.1%
SINGLE FATHER POVERTY
73.1/ 100
METRIC RATING
151st/ 347
METRIC RANK
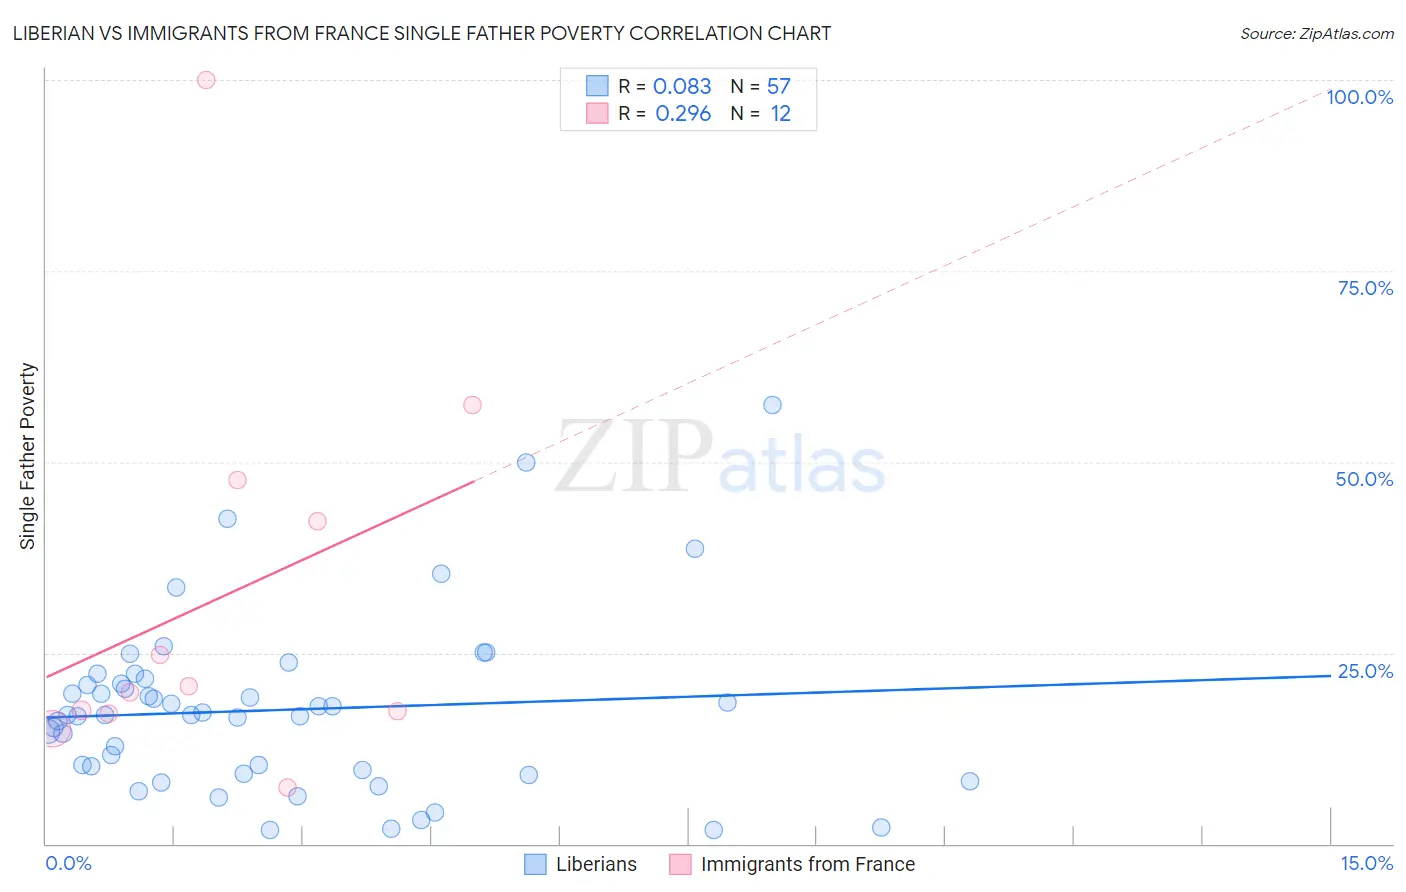
Liberian vs Immigrants from France Single Father Poverty Correlation Chart
The statistical analysis conducted on geographies consisting of 107,628,727 people shows a slight positive correlation between the proportion of Liberians and poverty level among single fathers in the United States with a correlation coefficient (R) of 0.083 and weighted average of 16.0%. Similarly, the statistical analysis conducted on geographies consisting of 232,790,194 people shows a weak positive correlation between the proportion of Immigrants from France and poverty level among single fathers in the United States with a correlation coefficient (R) of 0.296 and weighted average of 16.1%, a difference of 0.69%.
Single Father Poverty Correlation Summary
| Measurement | Liberian | Immigrants from France |
| Minimum | 1.7% | 7.4% |
| Maximum | 57.4% | 100.0% |
| Range | 55.7% | 92.6% |
| Mean | 17.5% | 32.2% |
| Median | 16.9% | 20.2% |
| Interquartile 25% (IQ1) | 9.4% | 17.2% |
| Interquartile 75% (IQ3) | 21.3% | 45.0% |
| Interquartile Range (IQR) | 11.9% | 27.8% |
| Standard Deviation (Sample) | 11.3% | 26.1% |
| Standard Deviation (Population) | 11.2% | 25.0% |
Demographics Similar to Liberians and Immigrants from France by Single Father Poverty
In terms of single father poverty, the demographic groups most similar to Liberians are Immigrants from Mexico (16.0%, a difference of 0.0%), Immigrants from Central America (16.0%, a difference of 0.020%), Immigrants from Kuwait (16.0%, a difference of 0.15%), Immigrants from Netherlands (16.0%, a difference of 0.17%), and Immigrants from Western Asia (16.0%, a difference of 0.20%). Similarly, the demographic groups most similar to Immigrants from France are Jordanian (16.1%, a difference of 0.060%), Immigrants from Zimbabwe (16.1%, a difference of 0.060%), Immigrants from Israel (16.1%, a difference of 0.060%), South African (16.1%, a difference of 0.12%), and Mexican (16.1%, a difference of 0.16%).
| Demographics | Rating | Rank | Single Father Poverty |
| Cypriots | 87.5 /100 | #136 | Excellent 15.9% |
| Immigrants | Azores | 87.2 /100 | #137 | Excellent 15.9% |
| Central Americans | 87.1 /100 | #138 | Excellent 16.0% |
| South Americans | 85.9 /100 | #139 | Excellent 16.0% |
| Immigrants | Netherlands | 85.3 /100 | #140 | Excellent 16.0% |
| Liberians | 83.3 /100 | #141 | Excellent 16.0% |
| Immigrants | Mexico | 83.3 /100 | #142 | Excellent 16.0% |
| Immigrants | Central America | 83.1 /100 | #143 | Excellent 16.0% |
| Immigrants | Kuwait | 81.4 /100 | #144 | Excellent 16.0% |
| Immigrants | Western Asia | 80.7 /100 | #145 | Excellent 16.0% |
| Immigrants | Hungary | 78.3 /100 | #146 | Good 16.1% |
| Colombians | 77.1 /100 | #147 | Good 16.1% |
| Nigerians | 76.8 /100 | #148 | Good 16.1% |
| South Africans | 75.1 /100 | #149 | Good 16.1% |
| Jordanians | 74.2 /100 | #150 | Good 16.1% |
| Immigrants | France | 73.1 /100 | #151 | Good 16.1% |
| Immigrants | Zimbabwe | 72.1 /100 | #152 | Good 16.1% |
| Immigrants | Israel | 72.0 /100 | #153 | Good 16.1% |
| Mexicans | 70.1 /100 | #154 | Good 16.1% |
| Immigrants | Nicaragua | 67.8 /100 | #155 | Good 16.2% |
| Immigrants | Jordan | 66.0 /100 | #156 | Good 16.2% |