Immigrants from Jordan vs Ethiopian Single Male Poverty
COMPARE
Immigrants from Jordan
Ethiopian
Single Male Poverty
Single Male Poverty Comparison
Immigrants from Jordan
Ethiopians
12.5%
SINGLE MALE POVERTY
87.1/ 100
METRIC RATING
125th/ 347
METRIC RANK
11.2%
SINGLE MALE POVERTY
100.0/ 100
METRIC RATING
20th/ 347
METRIC RANK
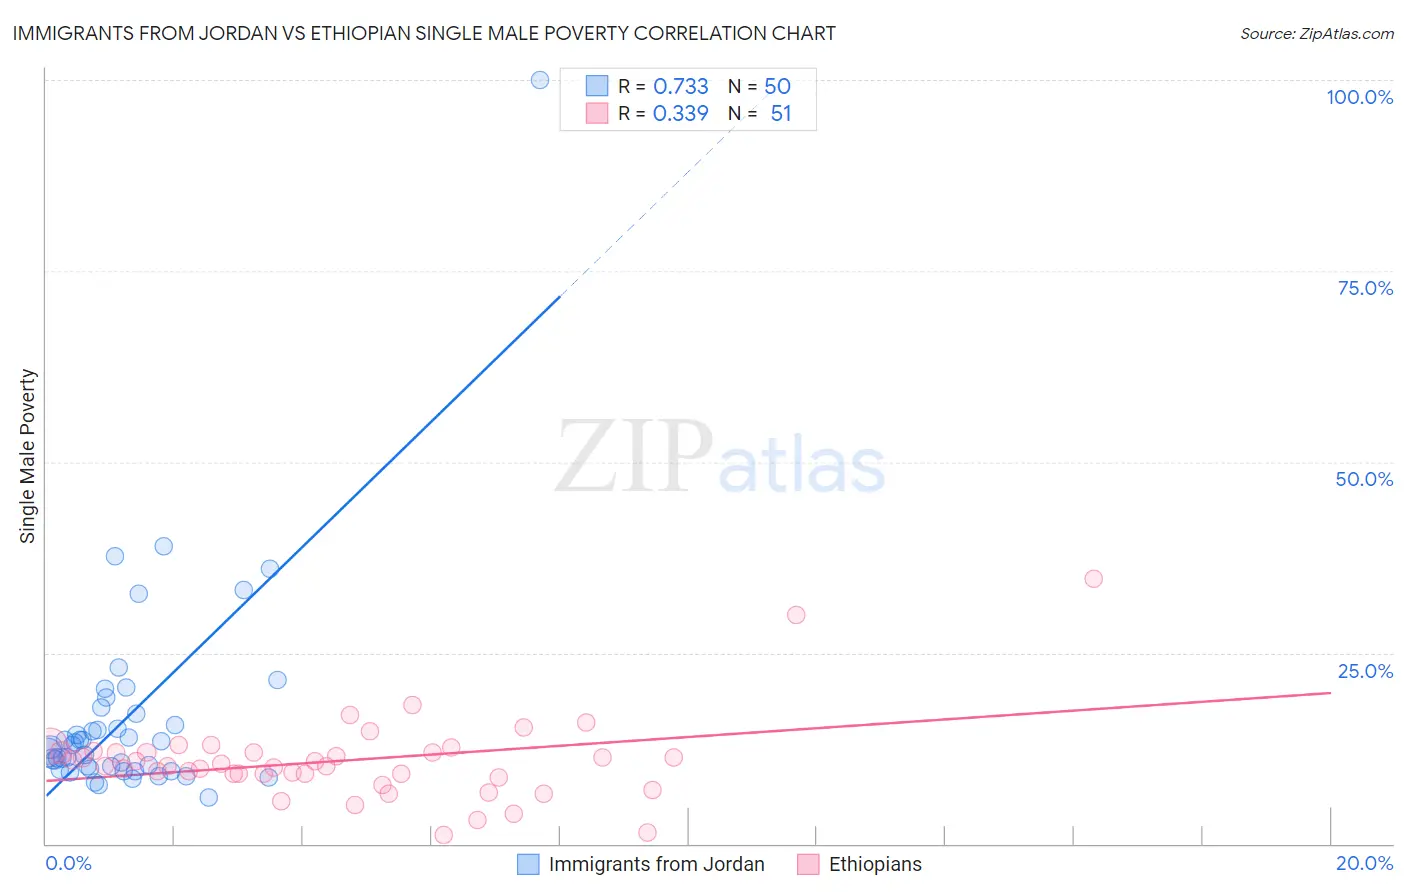
Immigrants from Jordan vs Ethiopian Single Male Poverty Correlation Chart
The statistical analysis conducted on geographies consisting of 169,036,341 people shows a strong positive correlation between the proportion of Immigrants from Jordan and poverty level among single males in the United States with a correlation coefficient (R) of 0.733 and weighted average of 12.5%. Similarly, the statistical analysis conducted on geographies consisting of 207,684,975 people shows a mild positive correlation between the proportion of Ethiopians and poverty level among single males in the United States with a correlation coefficient (R) of 0.339 and weighted average of 11.2%, a difference of 11.8%.
Single Male Poverty Correlation Summary
| Measurement | Immigrants from Jordan | Ethiopian |
| Minimum | 6.0% | 1.1% |
| Maximum | 100.0% | 34.7% |
| Range | 94.0% | 33.6% |
| Mean | 16.7% | 10.9% |
| Median | 12.8% | 10.2% |
| Interquartile 25% (IQ1) | 9.7% | 9.1% |
| Interquartile 75% (IQ3) | 17.1% | 11.9% |
| Interquartile Range (IQR) | 7.3% | 2.8% |
| Standard Deviation (Sample) | 14.4% | 5.6% |
| Standard Deviation (Population) | 14.3% | 5.5% |
Similar Demographics by Single Male Poverty
Demographics Similar to Immigrants from Jordan by Single Male Poverty
In terms of single male poverty, the demographic groups most similar to Immigrants from Jordan are Russian (12.5%, a difference of 0.030%), Immigrants from Kenya (12.5%, a difference of 0.060%), Romanian (12.5%, a difference of 0.080%), Serbian (12.5%, a difference of 0.10%), and Immigrants from Netherlands (12.5%, a difference of 0.10%).
| Demographics | Rating | Rank | Single Male Poverty |
| Albanians | 90.6 /100 | #118 | Exceptional 12.4% |
| Immigrants | Albania | 90.3 /100 | #119 | Exceptional 12.4% |
| Venezuelans | 89.4 /100 | #120 | Excellent 12.4% |
| Icelanders | 88.2 /100 | #121 | Excellent 12.5% |
| Serbians | 87.9 /100 | #122 | Excellent 12.5% |
| Immigrants | Kenya | 87.6 /100 | #123 | Excellent 12.5% |
| Russians | 87.3 /100 | #124 | Excellent 12.5% |
| Immigrants | Jordan | 87.1 /100 | #125 | Excellent 12.5% |
| Romanians | 86.4 /100 | #126 | Excellent 12.5% |
| Immigrants | Netherlands | 86.2 /100 | #127 | Excellent 12.5% |
| Ecuadorians | 85.9 /100 | #128 | Excellent 12.5% |
| Immigrants | Sierra Leone | 85.5 /100 | #129 | Excellent 12.5% |
| Immigrants | Nicaragua | 84.8 /100 | #130 | Excellent 12.5% |
| Immigrants | Northern Europe | 83.7 /100 | #131 | Excellent 12.5% |
| Salvadorans | 83.7 /100 | #132 | Excellent 12.5% |
Demographics Similar to Ethiopians by Single Male Poverty
In terms of single male poverty, the demographic groups most similar to Ethiopians are Immigrants from Moldova (11.2%, a difference of 0.020%), Asian (11.2%, a difference of 0.34%), Immigrants from Bolivia (11.1%, a difference of 0.41%), Immigrants from Pakistan (11.2%, a difference of 0.44%), and Bolivian (11.2%, a difference of 0.65%).
| Demographics | Rating | Rank | Single Male Poverty |
| Immigrants | South Central Asia | 100.0 /100 | #13 | Exceptional 10.9% |
| Chinese | 100.0 /100 | #14 | Exceptional 11.0% |
| Koreans | 100.0 /100 | #15 | Exceptional 11.0% |
| Bhutanese | 100.0 /100 | #16 | Exceptional 11.1% |
| Tsimshian | 100.0 /100 | #17 | Exceptional 11.1% |
| Immigrants | Bolivia | 100.0 /100 | #18 | Exceptional 11.1% |
| Immigrants | Moldova | 100.0 /100 | #19 | Exceptional 11.2% |
| Ethiopians | 100.0 /100 | #20 | Exceptional 11.2% |
| Asians | 100.0 /100 | #21 | Exceptional 11.2% |
| Immigrants | Pakistan | 100.0 /100 | #22 | Exceptional 11.2% |
| Bolivians | 100.0 /100 | #23 | Exceptional 11.2% |
| Indians (Asian) | 100.0 /100 | #24 | Exceptional 11.3% |
| Maltese | 100.0 /100 | #25 | Exceptional 11.3% |
| Immigrants | Japan | 100.0 /100 | #26 | Exceptional 11.3% |
| Immigrants | China | 100.0 /100 | #27 | Exceptional 11.4% |