Liberian vs Seminole Single Male Poverty
COMPARE
Liberian
Seminole
Single Male Poverty
Single Male Poverty Comparison
Liberians
Seminole
13.0%
SINGLE MALE POVERTY
25.2/ 100
METRIC RATING
194th/ 347
METRIC RANK
16.0%
SINGLE MALE POVERTY
0.0/ 100
METRIC RATING
311th/ 347
METRIC RANK
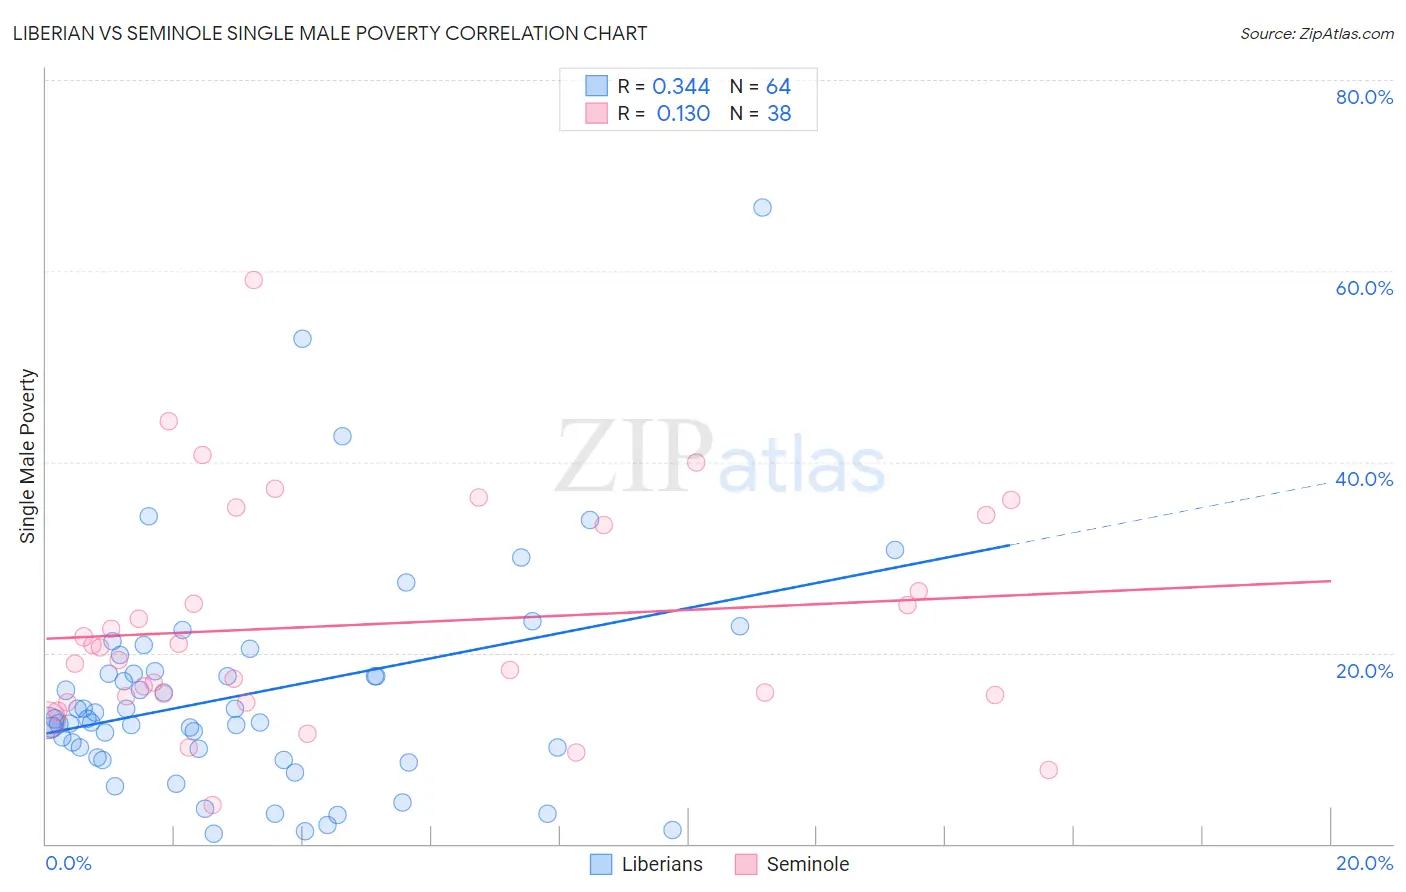
Liberian vs Seminole Single Male Poverty Correlation Chart
The statistical analysis conducted on geographies consisting of 112,749,237 people shows a mild positive correlation between the proportion of Liberians and poverty level among single males in the United States with a correlation coefficient (R) of 0.344 and weighted average of 13.0%. Similarly, the statistical analysis conducted on geographies consisting of 113,333,266 people shows a poor positive correlation between the proportion of Seminole and poverty level among single males in the United States with a correlation coefficient (R) of 0.130 and weighted average of 16.0%, a difference of 23.4%.
Single Male Poverty Correlation Summary
| Measurement | Liberian | Seminole |
| Minimum | 1.0% | 4.0% |
| Maximum | 66.7% | 59.1% |
| Range | 65.7% | 55.1% |
| Mean | 15.7% | 22.9% |
| Median | 12.9% | 19.9% |
| Interquartile 25% (IQ1) | 9.5% | 15.5% |
| Interquartile 75% (IQ3) | 17.9% | 33.3% |
| Interquartile Range (IQR) | 8.4% | 17.9% |
| Standard Deviation (Sample) | 11.6% | 11.7% |
| Standard Deviation (Population) | 11.5% | 11.6% |
Similar Demographics by Single Male Poverty
Demographics Similar to Liberians by Single Male Poverty
In terms of single male poverty, the demographic groups most similar to Liberians are Immigrants from South Africa (13.0%, a difference of 0.070%), Immigrants from Thailand (13.0%, a difference of 0.090%), Immigrants from Jamaica (13.0%, a difference of 0.090%), Arab (13.0%, a difference of 0.12%), and Immigrants from England (13.0%, a difference of 0.13%).
| Demographics | Rating | Rank | Single Male Poverty |
| Immigrants | Kuwait | 31.9 /100 | #187 | Fair 12.9% |
| Macedonians | 31.5 /100 | #188 | Fair 12.9% |
| Portuguese | 30.2 /100 | #189 | Fair 12.9% |
| Arabs | 27.0 /100 | #190 | Fair 13.0% |
| Immigrants | Thailand | 26.6 /100 | #191 | Fair 13.0% |
| Immigrants | Jamaica | 26.5 /100 | #192 | Fair 13.0% |
| Immigrants | South Africa | 26.1 /100 | #193 | Fair 13.0% |
| Liberians | 25.2 /100 | #194 | Fair 13.0% |
| Immigrants | England | 23.4 /100 | #195 | Fair 13.0% |
| Immigrants | Grenada | 23.1 /100 | #196 | Fair 13.0% |
| Immigrants | Laos | 23.1 /100 | #197 | Fair 13.0% |
| Lithuanians | 22.1 /100 | #198 | Fair 13.0% |
| Immigrants | Norway | 21.8 /100 | #199 | Fair 13.0% |
| Slovenes | 21.6 /100 | #200 | Fair 13.0% |
| Trinidadians and Tobagonians | 21.4 /100 | #201 | Fair 13.0% |
Demographics Similar to Seminole by Single Male Poverty
In terms of single male poverty, the demographic groups most similar to Seminole are Comanche (16.0%, a difference of 0.0%), Cherokee (16.1%, a difference of 0.23%), Alaskan Athabascan (16.1%, a difference of 0.52%), Yakama (15.9%, a difference of 0.54%), and Cheyenne (16.1%, a difference of 0.57%).
| Demographics | Rating | Rank | Single Male Poverty |
| Alaska Natives | 0.0 /100 | #304 | Tragic 15.4% |
| Blackfeet | 0.0 /100 | #305 | Tragic 15.5% |
| Pennsylvania Germans | 0.0 /100 | #306 | Tragic 15.6% |
| Ute | 0.0 /100 | #307 | Tragic 15.7% |
| Potawatomi | 0.0 /100 | #308 | Tragic 15.8% |
| Americans | 0.0 /100 | #309 | Tragic 15.8% |
| Yakama | 0.0 /100 | #310 | Tragic 15.9% |
| Seminole | 0.0 /100 | #311 | Tragic 16.0% |
| Comanche | 0.0 /100 | #312 | Tragic 16.0% |
| Cherokee | 0.0 /100 | #313 | Tragic 16.1% |
| Alaskan Athabascans | 0.0 /100 | #314 | Tragic 16.1% |
| Cheyenne | 0.0 /100 | #315 | Tragic 16.1% |
| Dutch West Indians | 0.0 /100 | #316 | Tragic 16.1% |
| Blacks/African Americans | 0.0 /100 | #317 | Tragic 16.2% |
| Chickasaw | 0.0 /100 | #318 | Tragic 16.3% |