Liberian vs Sioux Single Male Poverty
COMPARE
Liberian
Sioux
Single Male Poverty
Single Male Poverty Comparison
Liberians
Sioux
13.0%
SINGLE MALE POVERTY
25.2/ 100
METRIC RATING
194th/ 347
METRIC RANK
22.2%
SINGLE MALE POVERTY
0.0/ 100
METRIC RATING
340th/ 347
METRIC RANK
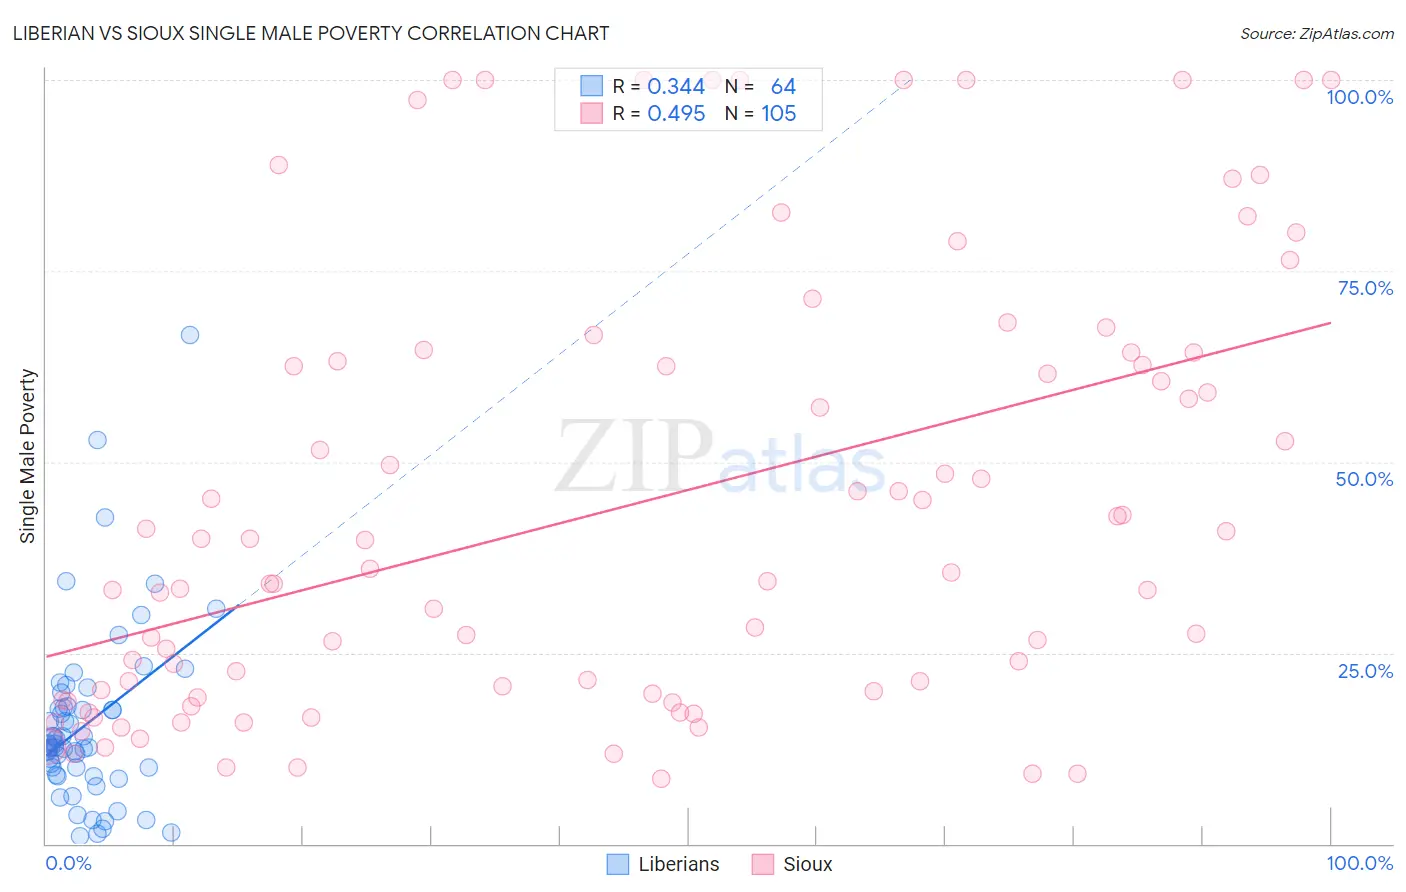
Liberian vs Sioux Single Male Poverty Correlation Chart
The statistical analysis conducted on geographies consisting of 112,749,237 people shows a mild positive correlation between the proportion of Liberians and poverty level among single males in the United States with a correlation coefficient (R) of 0.344 and weighted average of 13.0%. Similarly, the statistical analysis conducted on geographies consisting of 217,135,465 people shows a moderate positive correlation between the proportion of Sioux and poverty level among single males in the United States with a correlation coefficient (R) of 0.495 and weighted average of 22.2%, a difference of 71.1%.
Single Male Poverty Correlation Summary
| Measurement | Liberian | Sioux |
| Minimum | 1.0% | 8.6% |
| Maximum | 66.7% | 100.0% |
| Range | 65.7% | 91.4% |
| Mean | 15.7% | 44.2% |
| Median | 12.9% | 35.5% |
| Interquartile 25% (IQ1) | 9.5% | 19.4% |
| Interquartile 75% (IQ3) | 17.9% | 63.7% |
| Interquartile Range (IQR) | 8.4% | 44.3% |
| Standard Deviation (Sample) | 11.6% | 28.5% |
| Standard Deviation (Population) | 11.5% | 28.4% |
Similar Demographics by Single Male Poverty
Demographics Similar to Liberians by Single Male Poverty
In terms of single male poverty, the demographic groups most similar to Liberians are Immigrants from South Africa (13.0%, a difference of 0.070%), Immigrants from Thailand (13.0%, a difference of 0.090%), Immigrants from Jamaica (13.0%, a difference of 0.090%), Arab (13.0%, a difference of 0.12%), and Immigrants from England (13.0%, a difference of 0.13%).
| Demographics | Rating | Rank | Single Male Poverty |
| Immigrants | Kuwait | 31.9 /100 | #187 | Fair 12.9% |
| Macedonians | 31.5 /100 | #188 | Fair 12.9% |
| Portuguese | 30.2 /100 | #189 | Fair 12.9% |
| Arabs | 27.0 /100 | #190 | Fair 13.0% |
| Immigrants | Thailand | 26.6 /100 | #191 | Fair 13.0% |
| Immigrants | Jamaica | 26.5 /100 | #192 | Fair 13.0% |
| Immigrants | South Africa | 26.1 /100 | #193 | Fair 13.0% |
| Liberians | 25.2 /100 | #194 | Fair 13.0% |
| Immigrants | England | 23.4 /100 | #195 | Fair 13.0% |
| Immigrants | Grenada | 23.1 /100 | #196 | Fair 13.0% |
| Immigrants | Laos | 23.1 /100 | #197 | Fair 13.0% |
| Lithuanians | 22.1 /100 | #198 | Fair 13.0% |
| Immigrants | Norway | 21.8 /100 | #199 | Fair 13.0% |
| Slovenes | 21.6 /100 | #200 | Fair 13.0% |
| Trinidadians and Tobagonians | 21.4 /100 | #201 | Fair 13.0% |
Demographics Similar to Sioux by Single Male Poverty
In terms of single male poverty, the demographic groups most similar to Sioux are Arapaho (21.9%, a difference of 1.3%), Pueblo (21.6%, a difference of 2.8%), Apache (21.6%, a difference of 2.9%), Tohono O'odham (21.6%, a difference of 3.1%), and Yuman (21.3%, a difference of 4.3%).
| Demographics | Rating | Rank | Single Male Poverty |
| Inupiat | 0.0 /100 | #333 | Tragic 20.0% |
| Pima | 0.0 /100 | #334 | Tragic 20.2% |
| Yuman | 0.0 /100 | #335 | Tragic 21.3% |
| Tohono O'odham | 0.0 /100 | #336 | Tragic 21.6% |
| Apache | 0.0 /100 | #337 | Tragic 21.6% |
| Pueblo | 0.0 /100 | #338 | Tragic 21.6% |
| Arapaho | 0.0 /100 | #339 | Tragic 21.9% |
| Sioux | 0.0 /100 | #340 | Tragic 22.2% |
| Crow | 0.0 /100 | #341 | Tragic 23.3% |
| Houma | 0.0 /100 | #342 | Tragic 23.5% |
| Puerto Ricans | 0.0 /100 | #343 | Tragic 25.1% |
| Lumbee | 0.0 /100 | #344 | Tragic 25.2% |
| Navajo | 0.0 /100 | #345 | Tragic 25.3% |
| Hopi | 0.0 /100 | #346 | Tragic 27.5% |
| Yup'ik | 0.0 /100 | #347 | Tragic 31.6% |