Lebanese vs Norwegian Family Households with Children

COMPARE

Lebanese
Race
Ancestry
AfghanAfricanAlaska NativeAlaskan AthabascanAlbanianAleutAlsatianAmericanApacheArabArapahoArgentineanArmenianAssyrian/Chaldean/SyriacAustralianAustrianBahamianBangladeshiBarbadianBasqueBelgianBelizeanBermudanBhutaneseBlackfeetBolivianBrazilianBritishBritish West IndianBulgarianBurmeseCajunCambodianCanadianCape VerdeanCarpatho RusynCelticCentral AmericanCentral American IndianCherokeeCheyenneChickasawChileanChineseChippewaChoctawColombianColvilleComancheCosta RicanCreeCreekCroatianCrowCubanCypriotCzechCzechoslovakianDanishDelawareDominicanDutchDutch West IndianEastern EuropeanEcuadorianEgyptianEnglishEstonianEthiopianEuropeanFijianFilipinoFinnishFrenchFrench American IndianFrench CanadianGermanGerman RussianGhanaianGreekGuamanian/ChamorroGuatemalanGuyaneseHaitianHmongHonduranHopiHoumaHungarianIcelanderIndian (Asian)IndonesianInupiatIranianIraqiIrishIroquoisIsraeliItalianJamaicanJapaneseJordanianKenyanKiowaKoreanLaotianLatvianLebaneseLiberianLithuanianLumbeeLuxembourgerMacedonianMalaysianMalteseMarshalleseMenomineeMexicanMexican American IndianMongolianMoroccanNative HawaiianNavajoNepaleseNew ZealanderNicaraguanNigerianNorthern EuropeanOkinawanOsageOttawaPaiutePakistaniPalestinianPanamanianParaguayanPennsylvania GermanPeruvianPimaPolishPortuguesePotawatomiPuebloPuerto RicanPuget Sound SalishRomanianRussianSalvadoranSamoanScandinavianScotch-IrishScottishSeminoleSenegaleseSerbianShoshoneSierra LeoneanSiouxSlavicSlovakSloveneSomaliSouth AfricanSouth AmericanSouth American IndianSoviet UnionSpaniardSpanishSpanish AmericanSpanish American IndianSri LankanSubsaharan AfricanSudaneseSwedishSwissSyrianTaiwaneseThaiTlingit-HaidaTohono O'OdhamTonganTrinidadian and TobagonianTsimshianTurkishU.S. Virgin IslanderUgandanUkrainianUruguayanUteVenezuelanVietnameseWelshWest IndianYakamaYaquiYugoslavianYumanYup'ikZimbabwean
Immigration
NonimmigrantsImmigrantsAfghanistanAfricaAlbaniaArgentinaArmeniaAsiaAustraliaAustriaBahamasBangladeshBarbadosBelarusBelgiumBelizeBoliviaBosnia and HerzegovinaBrazilBulgariaBurma/MyanmarCabo VerdeCambodiaCameroonCanadaCaribbeanCentral AmericaChileChinaColombiaCongoCosta RicaCroatiaCubaCzechoslovakiaDenmarkDominicaDominican RepublicEastern AfricaEastern AsiaEastern EuropeEcuadorEgyptEl SalvadorEnglandEritreaEthiopiaEuropeFijiFranceGermanyGhanaGreeceGrenadaGuatemalaGuyanaHaitiHondurasHong KongHungaryIndiaIndonesiaIranIraqIrelandIsraelItalyJamaicaJapanJordanKazakhstanKenyaKoreaKuwaitLaosLatin AmericaLatviaLebanonLiberiaLithuaniaMalaysiaMexicoMicronesiaMiddle AfricaMoldovaMoroccoNepalNetherlandsNicaraguaNigeriaNorth AmericaNorth MacedoniaNorthern AfricaNorthern EuropeNorwayOceaniaPakistanPanamaPeruPhilippinesPolandPortugalRomaniaRussiaSaudi ArabiaScotlandSenegalSerbiaSierra LeoneSingaporeSomaliaSouth AfricaSouth AmericaSouth Central AsiaSouth Eastern AsiaSouthern EuropeSpainSri LankaSt. Vincent and the GrenadinesSudanSwedenSwitzerlandSyriaTaiwanThailandTrinidad and TobagoTurkeyUgandaUkraineUruguayUzbekistanVenezuelaVietnamWest IndiesWestern AfricaWestern AsiaWestern EuropeYemenZaireZimbabweAzores
Norwegian
Race
Ancestry
AfghanAfricanAlaska NativeAlaskan AthabascanAlbanianAleutAlsatianAmericanApacheArabArapahoArgentineanArmenianAssyrian/Chaldean/SyriacAustralianAustrianBahamianBangladeshiBarbadianBasqueBelgianBelizeanBermudanBhutaneseBlackfeetBolivianBrazilianBritishBritish West IndianBulgarianBurmeseCajunCambodianCanadianCape VerdeanCarpatho RusynCelticCentral AmericanCentral American IndianCherokeeCheyenneChickasawChileanChineseChippewaChoctawColombianColvilleComancheCosta RicanCreeCreekCroatianCrowCubanCypriotCzechCzechoslovakianDanishDelawareDominicanDutchDutch West IndianEastern EuropeanEcuadorianEgyptianEnglishEstonianEthiopianEuropeanFijianFilipinoFinnishFrenchFrench American IndianFrench CanadianGermanGerman RussianGhanaianGreekGuamanian/ChamorroGuatemalanGuyaneseHaitianHmongHonduranHopiHoumaHungarianIcelanderIndian (Asian)IndonesianInupiatIranianIraqiIrishIroquoisIsraeliItalianJamaicanJapaneseJordanianKenyanKiowaKoreanLaotianLatvianLiberianLithuanianLumbeeLuxembourgerMacedonianMalaysianMalteseMarshalleseMenomineeMexicanMexican American IndianMongolianMoroccanNative HawaiianNavajoNepaleseNew ZealanderNicaraguanNigerianNorthern EuropeanNorwegianOkinawanOsageOttawaPaiutePakistaniPalestinianPanamanianParaguayanPennsylvania GermanPeruvianPimaPolishPortuguesePotawatomiPuebloPuerto RicanPuget Sound SalishRomanianRussianSalvadoranSamoanScandinavianScotch-IrishScottishSeminoleSenegaleseSerbianShoshoneSierra LeoneanSiouxSlavicSlovakSloveneSomaliSouth AfricanSouth AmericanSouth American IndianSoviet UnionSpaniardSpanishSpanish AmericanSpanish American IndianSri LankanSubsaharan AfricanSudaneseSwedishSwissSyrianTaiwaneseThaiTlingit-HaidaTohono O'OdhamTonganTrinidadian and TobagonianTsimshianTurkishU.S. Virgin IslanderUgandanUkrainianUruguayanUteVenezuelanVietnameseWelshWest IndianYakamaYaquiYugoslavianYumanYup'ikZimbabwean
Immigration
NonimmigrantsImmigrantsAfghanistanAfricaAlbaniaArgentinaArmeniaAsiaAustraliaAustriaBahamasBangladeshBarbadosBelarusBelgiumBelizeBoliviaBosnia and HerzegovinaBrazilBulgariaBurma/MyanmarCabo VerdeCambodiaCameroonCanadaCaribbeanCentral AmericaChileChinaColombiaCongoCosta RicaCroatiaCubaCzechoslovakiaDenmarkDominicaDominican RepublicEastern AfricaEastern AsiaEastern EuropeEcuadorEgyptEl SalvadorEnglandEritreaEthiopiaEuropeFijiFranceGermanyGhanaGreeceGrenadaGuatemalaGuyanaHaitiHondurasHong KongHungaryIndiaIndonesiaIranIraqIrelandIsraelItalyJamaicaJapanJordanKazakhstanKenyaKoreaKuwaitLaosLatin AmericaLatviaLebanonLiberiaLithuaniaMalaysiaMexicoMicronesiaMiddle AfricaMoldovaMoroccoNepalNetherlandsNicaraguaNigeriaNorth AmericaNorth MacedoniaNorthern AfricaNorthern EuropeNorwayOceaniaPakistanPanamaPeruPhilippinesPolandPortugalRomaniaRussiaSaudi ArabiaScotlandSenegalSerbiaSierra LeoneSingaporeSomaliaSouth AfricaSouth AmericaSouth Central AsiaSouth Eastern AsiaSouthern EuropeSpainSri LankaSt. Vincent and the GrenadinesSudanSwedenSwitzerlandSyriaTaiwanThailandTrinidad and TobagoTurkeyUgandaUkraineUruguayUzbekistanVenezuelaVietnamWest IndiesWestern AfricaWestern AsiaWestern EuropeYemenZaireZimbabweAzores
Family Households with Children
Income
Poverty
Unemployment
Labor Participation
Family Structure
Vehicle Availability
Education Level
Disability

Family Households with Children Comparison

Lebanese

Norwegians

Excellent
Fair
27.7%
FAMILY HOUSEHOLDS WITH CHILDREN
87.4/ 100
METRIC RATING
131st/ 347
METRIC RANK
27.4%
FAMILY HOUSEHOLDS WITH CHILDREN
35.0/ 100
METRIC RATING
197th/ 347
METRIC RANK

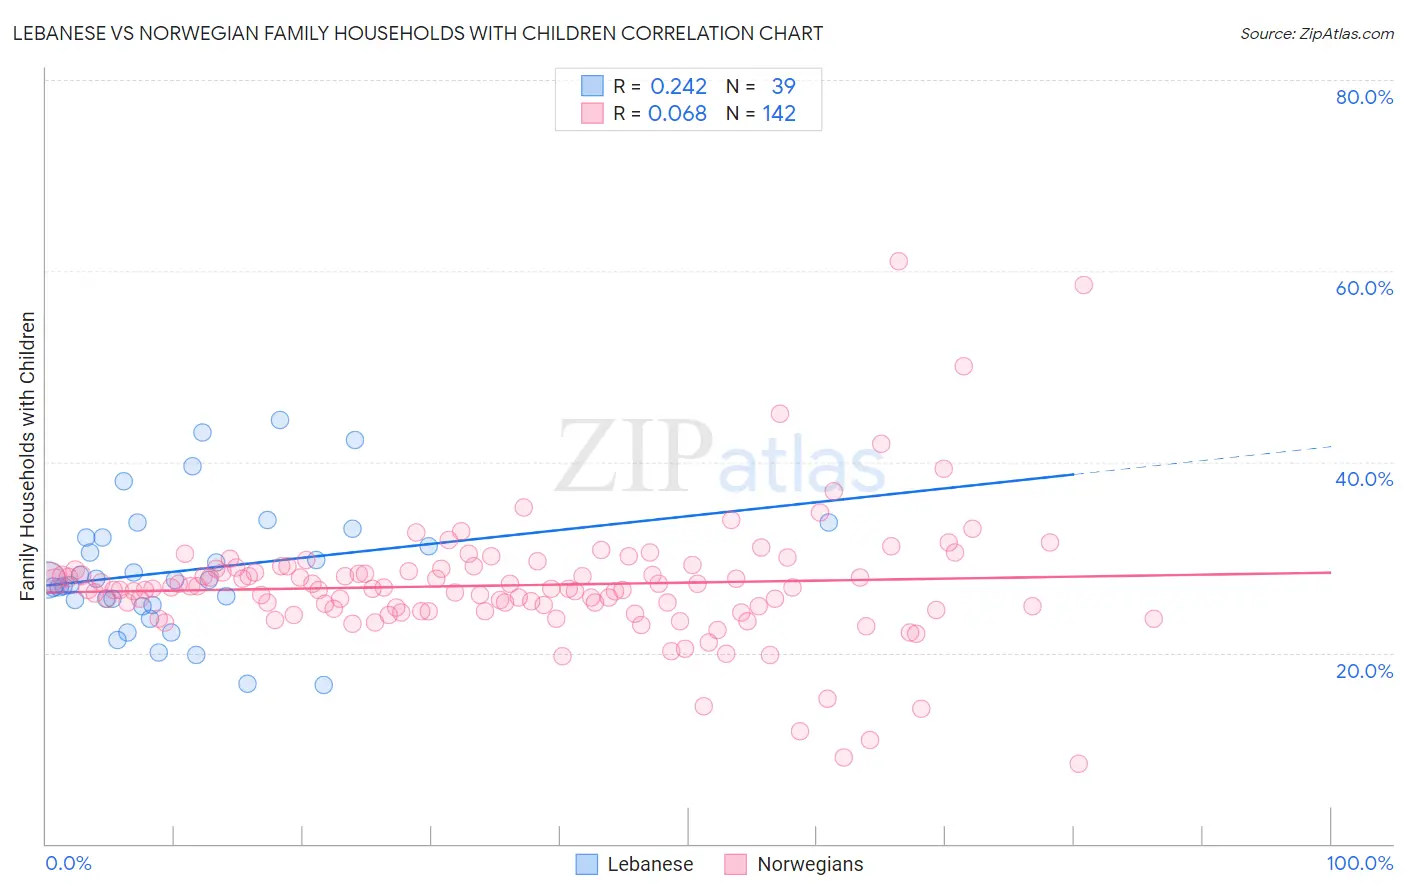
Lebanese vs Norwegian Family Households with Children Correlation Chart

The statistical analysis conducted on geographies consisting of 401,138,996 people shows a weak positive correlation between the proportion of Lebanese and percentage of family households with children in the United States with a correlation coefficient (R) of 0.242 and weighted average of 27.7%. Similarly, the statistical analysis conducted on geographies consisting of 532,567,428 people shows a slight positive correlation between the proportion of Norwegians and percentage of family households with children in the United States with a correlation coefficient (R) of 0.068 and weighted average of 27.4%, a difference of 1.4%.
Lebanese vs Norwegian Family Households with Children

Family Households with Children Correlation Summary

MeasurementLebaneseNorwegian
Minimum16.7%8.3%
Maximum44.4%61.1%
Range27.8%52.7%
Mean28.6%27.1%
Median27.6%26.7%
Interquartile 25% (IQ1)25.0%24.5%
Interquartile 75% (IQ3)32.1%28.8%
Interquartile Range (IQR)7.1%4.2%
Standard Deviation (Sample)6.6%6.7%
Standard Deviation (Population)6.5%6.7%

Similar Demographics by Family Households with Children

Demographics Similar to Lebanese by Family Households with Children

In terms of family households with children, the demographic groups most similar to Lebanese are Cajun (27.7%, a difference of 0.010%), Immigrants from Belize (27.7%, a difference of 0.080%), Immigrants from Eritrea (27.8%, a difference of 0.10%), Iranian (27.7%, a difference of 0.10%), and Syrian (27.8%, a difference of 0.12%).
DemographicsRating | RankFamily Households with Children
Immigrants | Singapore
90.8
/100
|
#124
Exceptional
27.8%
Ecuadorians
90.8
/100
|
#125
Exceptional
27.8%
Immigrants | Ethiopia
90.5
/100
|
#126
Exceptional
27.8%
Belizeans
90.0
/100
|
#127
Exceptional
27.8%
Syrians
89.7
/100
|
#128
Excellent
27.8%
Immigrants | Eritrea
89.4
/100
|
#129
Excellent
27.8%
Cajuns
87.6
/100
|
#130
Excellent
27.7%
Lebanese
87.4
/100
|
#131
Excellent
27.7%
Immigrants | Belize
85.7
/100
|
#132
Excellent
27.7%
Iranians
85.2
/100
|
#133
Excellent
27.7%
Immigrants | Panama
84.9
/100
|
#134
Excellent
27.7%
Immigrants | Ecuador
84.6
/100
|
#135
Excellent
27.7%
Immigrants | Portugal
84.1
/100
|
#136
Excellent
27.7%
Immigrants | Dominican Republic
83.9
/100
|
#137
Excellent
27.7%
Uruguayans
83.2
/100
|
#138
Excellent
27.7%

Demographics Similar to Norwegians by Family Households with Children

In terms of family households with children, the demographic groups most similar to Norwegians are Cheyenne (27.4%, a difference of 0.0%), Immigrants from Romania (27.4%, a difference of 0.010%), Crow (27.4%, a difference of 0.020%), Immigrants from Iran (27.4%, a difference of 0.030%), and Swedish (27.4%, a difference of 0.050%).
DemographicsRating | RankFamily Households with Children
Immigrants | Uruguay
37.7
/100
|
#190
Fair
27.4%
Sudanese
37.6
/100
|
#191
Fair
27.4%
Pennsylvania Germans
37.5
/100
|
#192
Fair
27.4%
Swedes
36.9
/100
|
#193
Fair
27.4%
Immigrants | Iran
36.1
/100
|
#194
Fair
27.4%
Crow
35.7
/100
|
#195
Fair
27.4%
Cheyenne
35.1
/100
|
#196
Fair
27.4%
Norwegians
35.0
/100
|
#197
Fair
27.4%
Immigrants | Romania
34.4
/100
|
#198
Fair
27.4%
English
32.0
/100
|
#199
Fair
27.3%
Immigrants | Congo
28.7
/100
|
#200
Fair
27.3%
Bhutanese
25.1
/100
|
#201
Fair
27.3%
Americans
22.8
/100
|
#202
Fair
27.3%
Kiowa
22.2
/100
|
#203
Fair
27.3%
Immigrants | Sudan
21.6
/100
|
#204
Fair
27.3%