Spanish American vs Norwegian Female Poverty
COMPARE
Spanish American
Norwegian
Female Poverty
Female Poverty Comparison
Spanish Americans
Norwegians
16.2%
FEMALE POVERTY
0.0/ 100
METRIC RATING
284th/ 347
METRIC RANK
11.5%
FEMALE POVERTY
99.8/ 100
METRIC RATING
19th/ 347
METRIC RANK
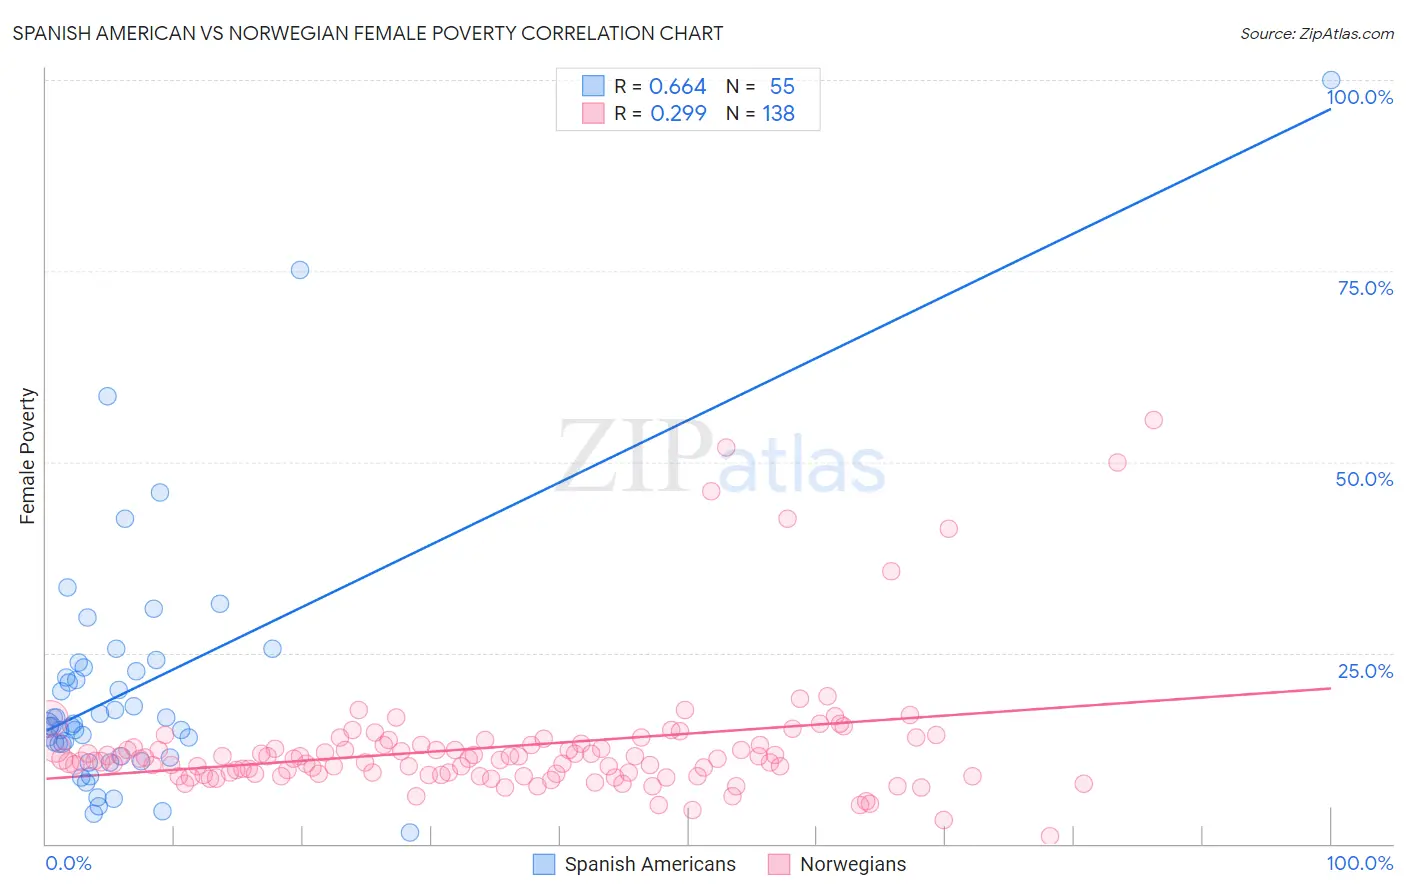
Spanish American vs Norwegian Female Poverty Correlation Chart
The statistical analysis conducted on geographies consisting of 103,161,919 people shows a significant positive correlation between the proportion of Spanish Americans and poverty level among females in the United States with a correlation coefficient (R) of 0.664 and weighted average of 16.2%. Similarly, the statistical analysis conducted on geographies consisting of 532,481,223 people shows a weak positive correlation between the proportion of Norwegians and poverty level among females in the United States with a correlation coefficient (R) of 0.299 and weighted average of 11.5%, a difference of 40.5%.
Female Poverty Correlation Summary
| Measurement | Spanish American | Norwegian |
| Minimum | 1.4% | 0.92% |
| Maximum | 100.0% | 55.6% |
| Range | 98.6% | 54.6% |
| Mean | 20.4% | 12.7% |
| Median | 15.6% | 11.1% |
| Interquartile 25% (IQ1) | 11.5% | 9.0% |
| Interquartile 75% (IQ3) | 23.0% | 12.9% |
| Interquartile Range (IQR) | 11.5% | 3.8% |
| Standard Deviation (Sample) | 17.0% | 8.4% |
| Standard Deviation (Population) | 16.8% | 8.4% |
Similar Demographics by Female Poverty
Demographics Similar to Spanish Americans by Female Poverty
In terms of female poverty, the demographic groups most similar to Spanish Americans are Immigrants from Cuba (16.1%, a difference of 0.050%), Comanche (16.2%, a difference of 0.080%), Immigrants from Haiti (16.1%, a difference of 0.13%), West Indian (16.1%, a difference of 0.29%), and Vietnamese (16.1%, a difference of 0.31%).
| Demographics | Rating | Rank | Female Poverty |
| Bangladeshis | 0.0 /100 | #277 | Tragic 16.0% |
| Immigrants | West Indies | 0.0 /100 | #278 | Tragic 16.1% |
| Immigrants | Bahamas | 0.0 /100 | #279 | Tragic 16.1% |
| Vietnamese | 0.0 /100 | #280 | Tragic 16.1% |
| West Indians | 0.0 /100 | #281 | Tragic 16.1% |
| Immigrants | Haiti | 0.0 /100 | #282 | Tragic 16.1% |
| Immigrants | Cuba | 0.0 /100 | #283 | Tragic 16.1% |
| Spanish Americans | 0.0 /100 | #284 | Tragic 16.2% |
| Comanche | 0.0 /100 | #285 | Tragic 16.2% |
| Inupiat | 0.0 /100 | #286 | Tragic 16.2% |
| Immigrants | Belize | 0.0 /100 | #287 | Tragic 16.3% |
| Indonesians | 0.0 /100 | #288 | Tragic 16.4% |
| Blackfeet | 0.0 /100 | #289 | Tragic 16.4% |
| Immigrants | Bangladesh | 0.0 /100 | #290 | Tragic 16.4% |
| Yaqui | 0.0 /100 | #291 | Tragic 16.4% |
Demographics Similar to Norwegians by Female Poverty
In terms of female poverty, the demographic groups most similar to Norwegians are Immigrants from Scotland (11.5%, a difference of 0.040%), Bolivian (11.5%, a difference of 0.090%), Immigrants from Bolivia (11.5%, a difference of 0.16%), Eastern European (11.5%, a difference of 0.23%), and Latvian (11.4%, a difference of 0.64%).
| Demographics | Rating | Rank | Female Poverty |
| Bhutanese | 99.9 /100 | #12 | Exceptional 11.3% |
| Immigrants | Lithuania | 99.9 /100 | #13 | Exceptional 11.3% |
| Lithuanians | 99.8 /100 | #14 | Exceptional 11.4% |
| Latvians | 99.8 /100 | #15 | Exceptional 11.4% |
| Immigrants | Bolivia | 99.8 /100 | #16 | Exceptional 11.5% |
| Bolivians | 99.8 /100 | #17 | Exceptional 11.5% |
| Immigrants | Scotland | 99.8 /100 | #18 | Exceptional 11.5% |
| Norwegians | 99.8 /100 | #19 | Exceptional 11.5% |
| Eastern Europeans | 99.7 /100 | #20 | Exceptional 11.5% |
| Italians | 99.7 /100 | #21 | Exceptional 11.6% |
| Swedes | 99.7 /100 | #22 | Exceptional 11.6% |
| Burmese | 99.7 /100 | #23 | Exceptional 11.6% |
| Luxembourgers | 99.7 /100 | #24 | Exceptional 11.6% |
| Immigrants | Northern Europe | 99.6 /100 | #25 | Exceptional 11.6% |
| Croatians | 99.6 /100 | #26 | Exceptional 11.6% |