Kenyan vs French American Indian Householder Income Ages 45 - 64 years
COMPARE
Kenyan
French American Indian
Householder Income Ages 45 - 64 years
Householder Income Ages 45 - 64 years Comparison
Kenyans
French American Indians
$98,970
HOUSEHOLDER INCOME AGES 45 - 64 YEARS
33.7/ 100
METRIC RATING
191st/ 347
METRIC RANK
$89,811
HOUSEHOLDER INCOME AGES 45 - 64 YEARS
0.5/ 100
METRIC RATING
256th/ 347
METRIC RANK
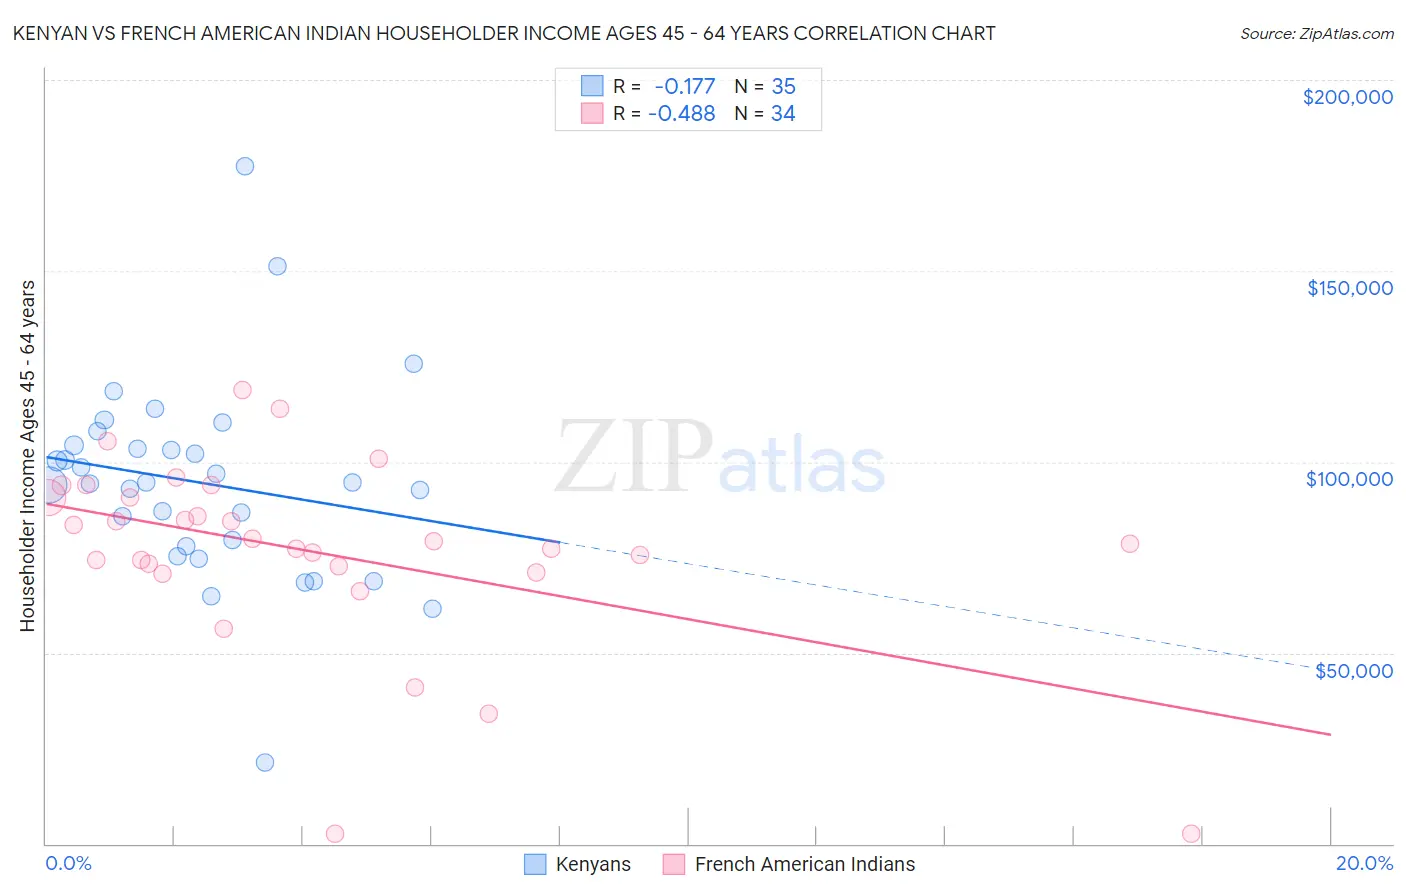
Kenyan vs French American Indian Householder Income Ages 45 - 64 years Correlation Chart
The statistical analysis conducted on geographies consisting of 168,091,431 people shows a poor negative correlation between the proportion of Kenyans and household income with householder between the ages 45 and 64 in the United States with a correlation coefficient (R) of -0.177 and weighted average of $98,970. Similarly, the statistical analysis conducted on geographies consisting of 131,896,651 people shows a moderate negative correlation between the proportion of French American Indians and household income with householder between the ages 45 and 64 in the United States with a correlation coefficient (R) of -0.488 and weighted average of $89,811, a difference of 10.2%.
Householder Income Ages 45 - 64 years Correlation Summary
| Measurement | Kenyan | French American Indian |
| Minimum | $21,397 | $2,499 |
| Maximum | $177,411 | $118,854 |
| Range | $156,014 | $116,355 |
| Mean | $94,546 | $76,575 |
| Median | $94,444 | $78,869 |
| Interquartile 25% (IQ1) | $77,946 | $72,546 |
| Interquartile 75% (IQ3) | $104,327 | $90,690 |
| Interquartile Range (IQR) | $26,381 | $18,144 |
| Standard Deviation (Sample) | $26,525 | $25,412 |
| Standard Deviation (Population) | $26,144 | $25,035 |
Similar Demographics by Householder Income Ages 45 - 64 years
Demographics Similar to Kenyans by Householder Income Ages 45 - 64 years
In terms of householder income ages 45 - 64 years, the demographic groups most similar to Kenyans are Celtic ($98,896, a difference of 0.070%), French Canadian ($99,093, a difference of 0.12%), Immigrants from South America ($99,126, a difference of 0.16%), Hawaiian ($98,778, a difference of 0.19%), and Immigrants from Portugal ($99,203, a difference of 0.24%).
| Demographics | Rating | Rank | Householder Income Ages 45 - 64 years |
| French | 43.8 /100 | #184 | Average $99,824 |
| Colombians | 43.2 /100 | #185 | Average $99,772 |
| Dutch | 41.7 /100 | #186 | Average $99,650 |
| Iraqis | 38.5 /100 | #187 | Fair $99,387 |
| Immigrants | Portugal | 36.3 /100 | #188 | Fair $99,203 |
| Immigrants | South America | 35.4 /100 | #189 | Fair $99,126 |
| French Canadians | 35.1 /100 | #190 | Fair $99,093 |
| Kenyans | 33.7 /100 | #191 | Fair $98,970 |
| Celtics | 32.9 /100 | #192 | Fair $98,896 |
| Hawaiians | 31.6 /100 | #193 | Fair $98,778 |
| Uruguayans | 30.3 /100 | #194 | Fair $98,660 |
| Spanish | 29.2 /100 | #195 | Fair $98,554 |
| Immigrants | Eastern Africa | 28.3 /100 | #196 | Fair $98,467 |
| Puget Sound Salish | 27.0 /100 | #197 | Fair $98,340 |
| Immigrants | Iraq | 25.7 /100 | #198 | Fair $98,201 |
Demographics Similar to French American Indians by Householder Income Ages 45 - 64 years
In terms of householder income ages 45 - 64 years, the demographic groups most similar to French American Indians are West Indian ($89,906, a difference of 0.11%), Immigrants from Guyana ($90,186, a difference of 0.42%), German Russian ($89,398, a difference of 0.46%), Immigrants from Barbados ($89,394, a difference of 0.47%), and Barbadian ($90,266, a difference of 0.51%).
| Demographics | Rating | Rank | Householder Income Ages 45 - 64 years |
| Mexican American Indians | 0.8 /100 | #249 | Tragic $90,811 |
| Sub-Saharan Africans | 0.8 /100 | #250 | Tragic $90,691 |
| Americans | 0.7 /100 | #251 | Tragic $90,536 |
| Marshallese | 0.7 /100 | #252 | Tragic $90,455 |
| Barbadians | 0.6 /100 | #253 | Tragic $90,266 |
| Immigrants | Guyana | 0.6 /100 | #254 | Tragic $90,186 |
| West Indians | 0.5 /100 | #255 | Tragic $89,906 |
| French American Indians | 0.5 /100 | #256 | Tragic $89,811 |
| German Russians | 0.4 /100 | #257 | Tragic $89,398 |
| Immigrants | Barbados | 0.4 /100 | #258 | Tragic $89,394 |
| Immigrants | Nicaragua | 0.4 /100 | #259 | Tragic $89,108 |
| Liberians | 0.3 /100 | #260 | Tragic $88,929 |
| Belizeans | 0.3 /100 | #261 | Tragic $88,684 |
| Somalis | 0.3 /100 | #262 | Tragic $88,600 |
| Immigrants | Senegal | 0.3 /100 | #263 | Tragic $88,421 |