Immigrants from Mexico vs Somali Single Mother Poverty
COMPARE
Immigrants from Mexico
Somali
Single Mother Poverty
Single Mother Poverty Comparison
Immigrants from Mexico
Somalis
34.0%
SINGLE MOTHER POVERTY
0.0/ 100
METRIC RATING
308th/ 347
METRIC RANK
32.6%
SINGLE MOTHER POVERTY
0.0/ 100
METRIC RATING
288th/ 347
METRIC RANK
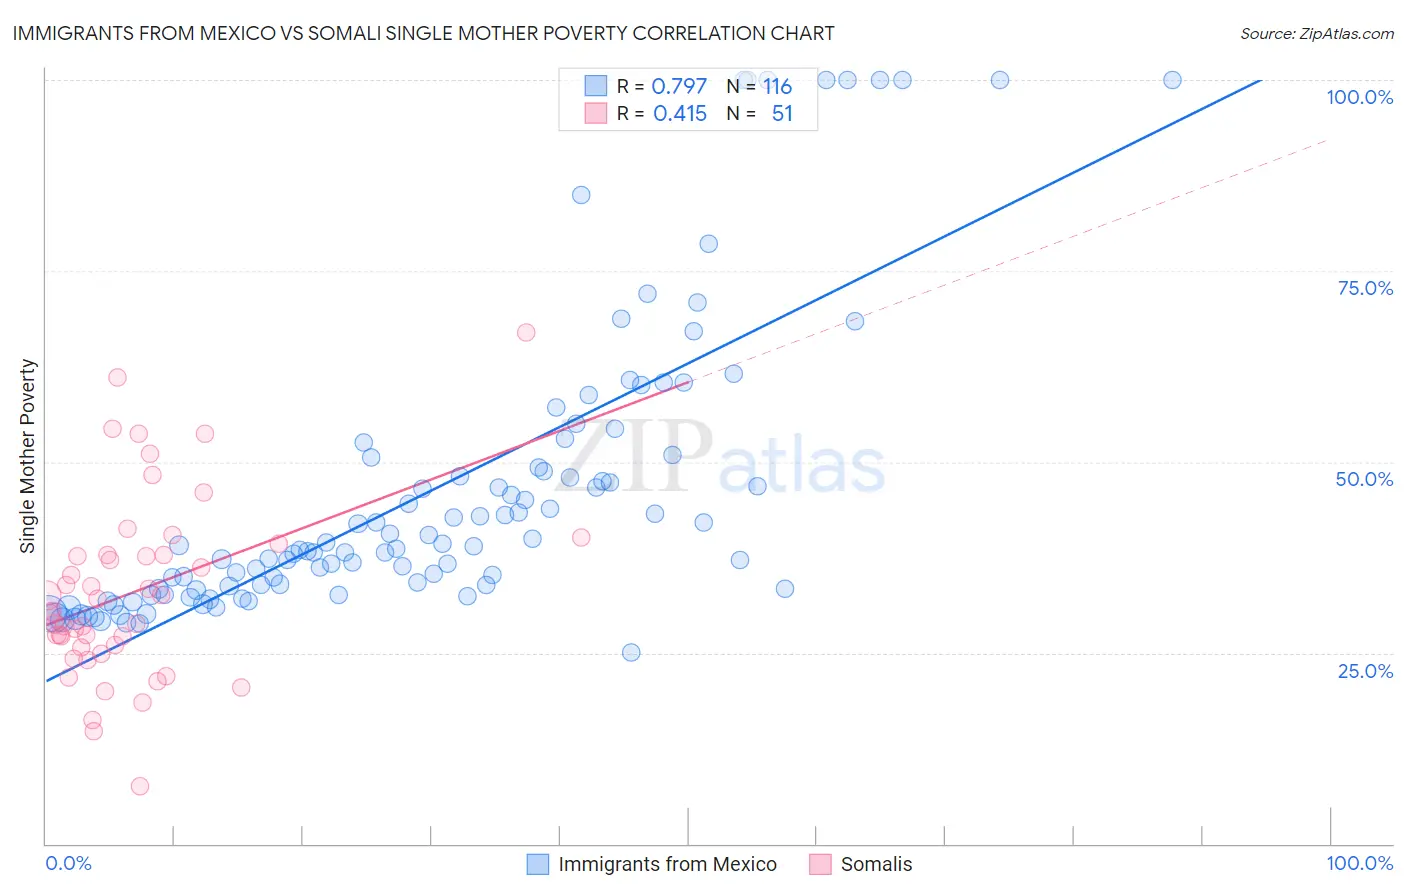
Immigrants from Mexico vs Somali Single Mother Poverty Correlation Chart
The statistical analysis conducted on geographies consisting of 497,741,826 people shows a strong positive correlation between the proportion of Immigrants from Mexico and poverty level among single mothers in the United States with a correlation coefficient (R) of 0.797 and weighted average of 34.0%. Similarly, the statistical analysis conducted on geographies consisting of 98,871,600 people shows a moderate positive correlation between the proportion of Somalis and poverty level among single mothers in the United States with a correlation coefficient (R) of 0.415 and weighted average of 32.6%, a difference of 4.4%.
Single Mother Poverty Correlation Summary
| Measurement | Immigrants from Mexico | Somali |
| Minimum | 25.0% | 7.5% |
| Maximum | 100.0% | 66.9% |
| Range | 75.0% | 59.4% |
| Mean | 46.2% | 33.0% |
| Median | 38.8% | 30.4% |
| Interquartile 25% (IQ1) | 33.4% | 25.7% |
| Interquartile 75% (IQ3) | 49.9% | 37.9% |
| Interquartile Range (IQR) | 16.5% | 12.2% |
| Standard Deviation (Sample) | 19.4% | 11.9% |
| Standard Deviation (Population) | 19.3% | 11.8% |
Demographics Similar to Immigrants from Mexico and Somalis by Single Mother Poverty
In terms of single mother poverty, the demographic groups most similar to Immigrants from Mexico are Comanche (33.9%, a difference of 0.18%), Immigrants from Congo (33.8%, a difference of 0.60%), Immigrants from Central America (33.6%, a difference of 1.2%), Mexican (33.6%, a difference of 1.3%), and American (33.5%, a difference of 1.4%). Similarly, the demographic groups most similar to Somalis are U.S. Virgin Islander (32.6%, a difference of 0.030%), Osage (32.6%, a difference of 0.14%), Guatemalan (32.9%, a difference of 1.0%), Shoshone (32.9%, a difference of 1.1%), and Aleut (32.9%, a difference of 1.1%).
| Demographics | Rating | Rank | Single Mother Poverty |
| Somalis | 0.0 /100 | #288 | Tragic 32.6% |
| U.S. Virgin Islanders | 0.0 /100 | #289 | Tragic 32.6% |
| Osage | 0.0 /100 | #290 | Tragic 32.6% |
| Guatemalans | 0.0 /100 | #291 | Tragic 32.9% |
| Shoshone | 0.0 /100 | #292 | Tragic 32.9% |
| Aleuts | 0.0 /100 | #293 | Tragic 32.9% |
| French American Indians | 0.0 /100 | #294 | Tragic 33.1% |
| Yaqui | 0.0 /100 | #295 | Tragic 33.1% |
| Blackfeet | 0.0 /100 | #296 | Tragic 33.2% |
| Pennsylvania Germans | 0.0 /100 | #297 | Tragic 33.2% |
| Africans | 0.0 /100 | #298 | Tragic 33.3% |
| Immigrants | Guatemala | 0.0 /100 | #299 | Tragic 33.3% |
| Hispanics or Latinos | 0.0 /100 | #300 | Tragic 33.3% |
| Immigrants | Somalia | 0.0 /100 | #301 | Tragic 33.4% |
| Arapaho | 0.0 /100 | #302 | Tragic 33.4% |
| Americans | 0.0 /100 | #303 | Tragic 33.5% |
| Mexicans | 0.0 /100 | #304 | Tragic 33.6% |
| Immigrants | Central America | 0.0 /100 | #305 | Tragic 33.6% |
| Immigrants | Congo | 0.0 /100 | #306 | Tragic 33.8% |
| Comanche | 0.0 /100 | #307 | Tragic 33.9% |
| Immigrants | Mexico | 0.0 /100 | #308 | Tragic 34.0% |