Jamaican vs Immigrants from Moldova Householder Income Ages 45 - 64 years
COMPARE
Jamaican
Immigrants from Moldova
Householder Income Ages 45 - 64 years
Householder Income Ages 45 - 64 years Comparison
Jamaicans
Immigrants from Moldova
$88,327
HOUSEHOLDER INCOME AGES 45 - 64 YEARS
0.2/ 100
METRIC RATING
265th/ 347
METRIC RANK
$107,357
HOUSEHOLDER INCOME AGES 45 - 64 YEARS
97.1/ 100
METRIC RATING
102nd/ 347
METRIC RANK
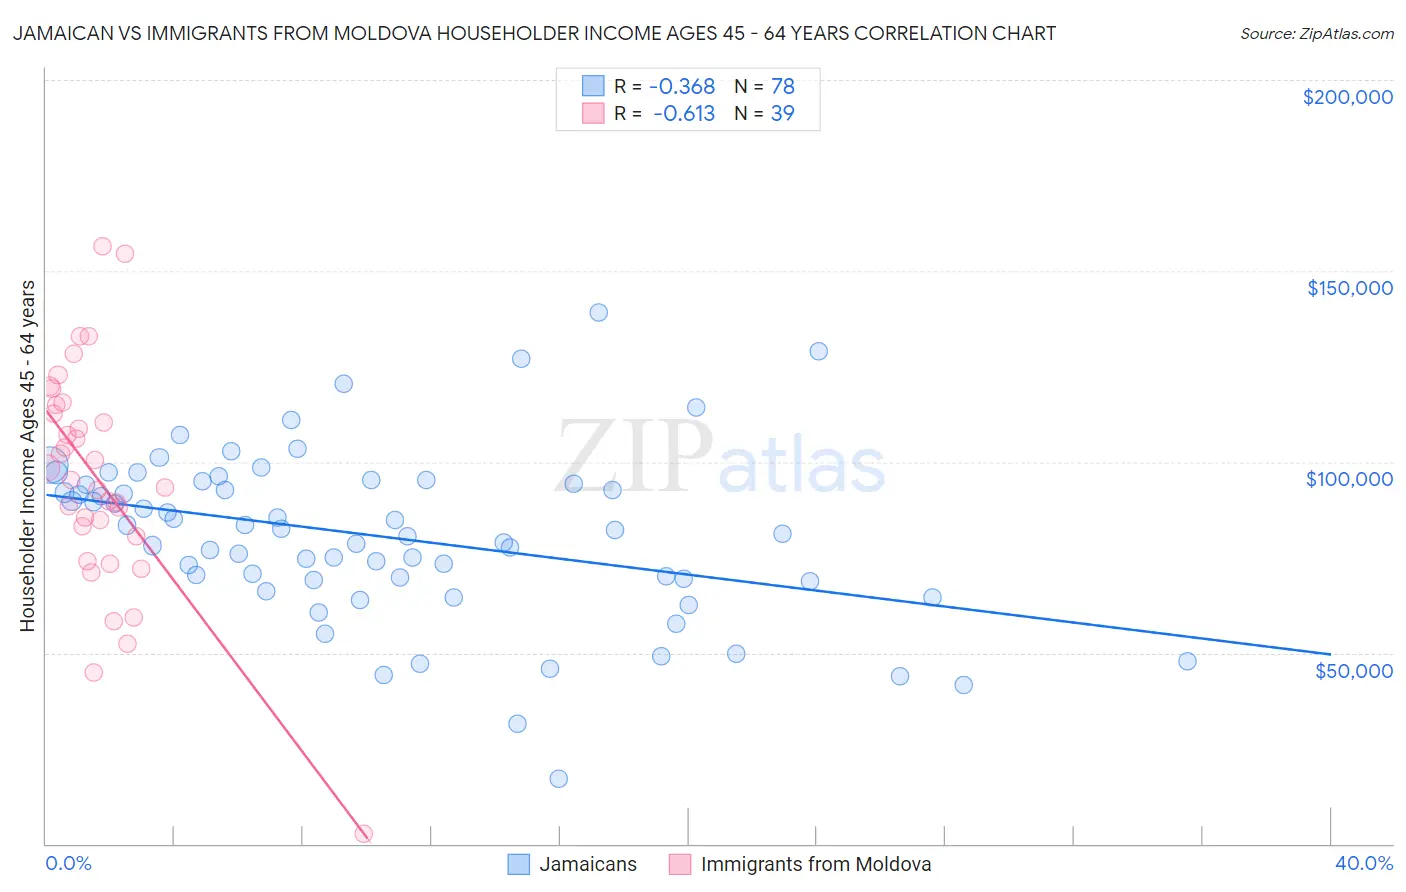
Jamaican vs Immigrants from Moldova Householder Income Ages 45 - 64 years Correlation Chart
The statistical analysis conducted on geographies consisting of 367,130,197 people shows a mild negative correlation between the proportion of Jamaicans and household income with householder between the ages 45 and 64 in the United States with a correlation coefficient (R) of -0.368 and weighted average of $88,327. Similarly, the statistical analysis conducted on geographies consisting of 124,350,842 people shows a significant negative correlation between the proportion of Immigrants from Moldova and household income with householder between the ages 45 and 64 in the United States with a correlation coefficient (R) of -0.613 and weighted average of $107,357, a difference of 21.5%.
Householder Income Ages 45 - 64 years Correlation Summary
| Measurement | Jamaican | Immigrants from Moldova |
| Minimum | $17,167 | $2,499 |
| Maximum | $139,000 | $156,555 |
| Range | $121,833 | $154,056 |
| Mean | $80,364 | $95,532 |
| Median | $81,673 | $95,372 |
| Interquartile 25% (IQ1) | $68,925 | $80,570 |
| Interquartile 75% (IQ3) | $94,316 | $114,888 |
| Interquartile Range (IQR) | $25,392 | $34,318 |
| Standard Deviation (Sample) | $22,119 | $29,698 |
| Standard Deviation (Population) | $21,977 | $29,315 |
Similar Demographics by Householder Income Ages 45 - 64 years
Demographics Similar to Jamaicans by Householder Income Ages 45 - 64 years
In terms of householder income ages 45 - 64 years, the demographic groups most similar to Jamaicans are Osage ($88,390, a difference of 0.070%), Immigrants from Senegal ($88,421, a difference of 0.11%), Immigrants from West Indies ($88,164, a difference of 0.19%), Hmong ($88,115, a difference of 0.24%), and Somali ($88,600, a difference of 0.31%).
| Demographics | Rating | Rank | Householder Income Ages 45 - 64 years |
| Immigrants | Barbados | 0.4 /100 | #258 | Tragic $89,394 |
| Immigrants | Nicaragua | 0.4 /100 | #259 | Tragic $89,108 |
| Liberians | 0.3 /100 | #260 | Tragic $88,929 |
| Belizeans | 0.3 /100 | #261 | Tragic $88,684 |
| Somalis | 0.3 /100 | #262 | Tragic $88,600 |
| Immigrants | Senegal | 0.3 /100 | #263 | Tragic $88,421 |
| Osage | 0.3 /100 | #264 | Tragic $88,390 |
| Jamaicans | 0.2 /100 | #265 | Tragic $88,327 |
| Immigrants | West Indies | 0.2 /100 | #266 | Tragic $88,164 |
| Hmong | 0.2 /100 | #267 | Tragic $88,115 |
| Immigrants | Micronesia | 0.2 /100 | #268 | Tragic $87,864 |
| Spanish Americans | 0.2 /100 | #269 | Tragic $87,836 |
| Immigrants | Liberia | 0.2 /100 | #270 | Tragic $87,739 |
| Guatemalans | 0.2 /100 | #271 | Tragic $87,705 |
| Cape Verdeans | 0.2 /100 | #272 | Tragic $87,580 |
Demographics Similar to Immigrants from Moldova by Householder Income Ages 45 - 64 years
In terms of householder income ages 45 - 64 years, the demographic groups most similar to Immigrants from Moldova are Immigrants from Kazakhstan ($107,378, a difference of 0.020%), Syrian ($107,207, a difference of 0.14%), Immigrants from Serbia ($107,569, a difference of 0.20%), Immigrants from Ukraine ($107,079, a difference of 0.26%), and Macedonian ($107,074, a difference of 0.26%).
| Demographics | Rating | Rank | Householder Income Ages 45 - 64 years |
| Immigrants | Hungary | 98.2 /100 | #95 | Exceptional $108,267 |
| Immigrants | Argentina | 98.2 /100 | #96 | Exceptional $108,264 |
| Northern Europeans | 97.8 /100 | #97 | Exceptional $107,870 |
| Immigrants | Southern Europe | 97.7 /100 | #98 | Exceptional $107,775 |
| Palestinians | 97.6 /100 | #99 | Exceptional $107,721 |
| Immigrants | Serbia | 97.4 /100 | #100 | Exceptional $107,569 |
| Immigrants | Kazakhstan | 97.2 /100 | #101 | Exceptional $107,378 |
| Immigrants | Moldova | 97.1 /100 | #102 | Exceptional $107,357 |
| Syrians | 96.9 /100 | #103 | Exceptional $107,207 |
| Immigrants | Ukraine | 96.7 /100 | #104 | Exceptional $107,079 |
| Macedonians | 96.7 /100 | #105 | Exceptional $107,074 |
| Armenians | 96.6 /100 | #106 | Exceptional $107,002 |
| Immigrants | Fiji | 96.5 /100 | #107 | Exceptional $106,952 |
| Zimbabweans | 96.3 /100 | #108 | Exceptional $106,849 |
| Chileans | 95.9 /100 | #109 | Exceptional $106,611 |