Jamaican vs Bulgarian Unemployment
COMPARE
Jamaican
Bulgarian
Unemployment
Unemployment Comparison
Jamaicans
Bulgarians
6.3%
UNEMPLOYMENT
0.0/ 100
METRIC RATING
297th/ 347
METRIC RANK
4.7%
UNEMPLOYMENT
99.9/ 100
METRIC RATING
26th/ 347
METRIC RANK
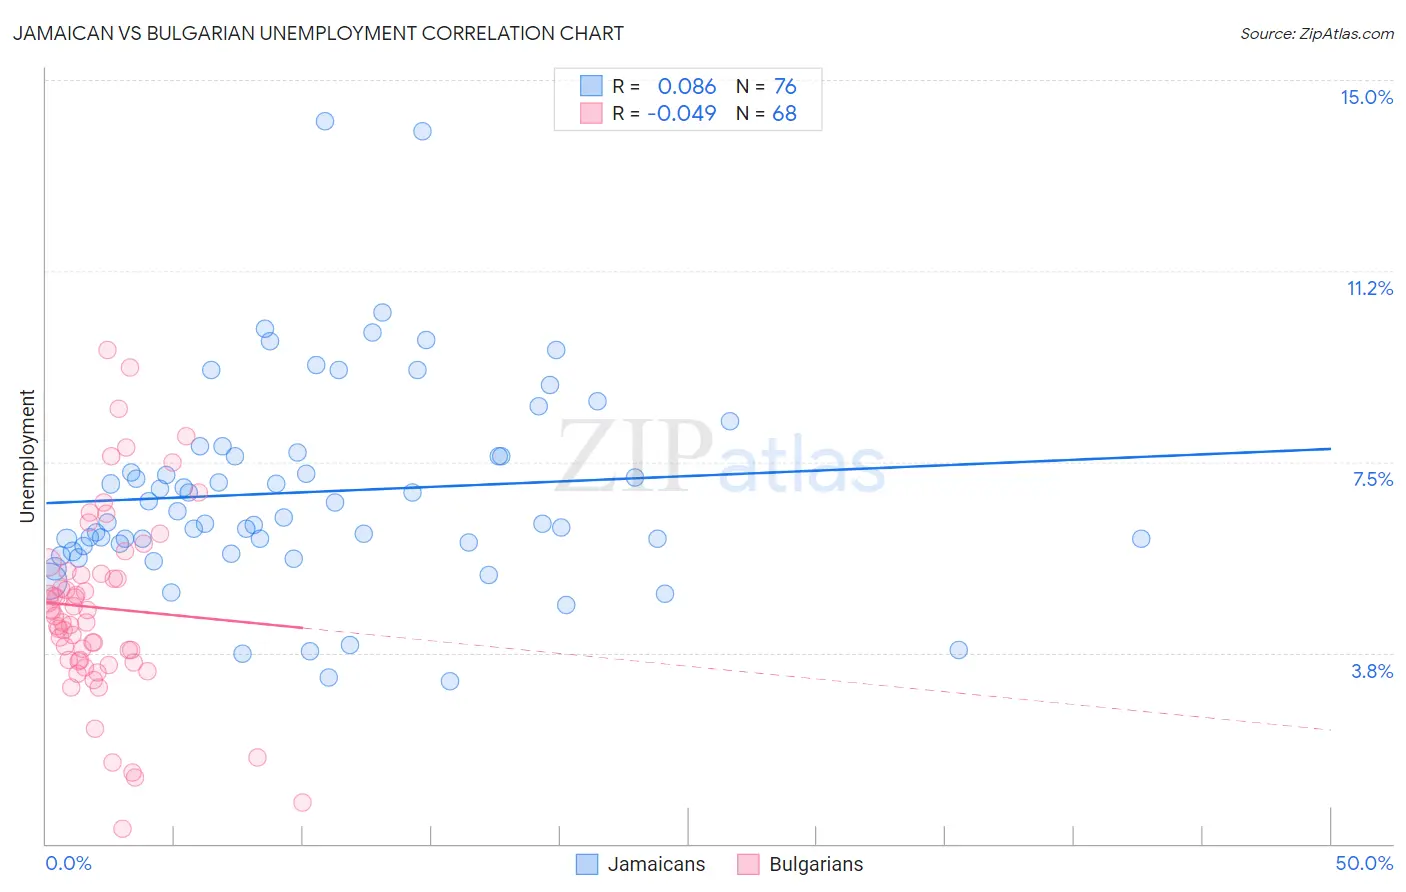
Jamaican vs Bulgarian Unemployment Correlation Chart
The statistical analysis conducted on geographies consisting of 367,761,379 people shows a slight positive correlation between the proportion of Jamaicans and unemployment in the United States with a correlation coefficient (R) of 0.086 and weighted average of 6.3%. Similarly, the statistical analysis conducted on geographies consisting of 205,555,783 people shows no correlation between the proportion of Bulgarians and unemployment in the United States with a correlation coefficient (R) of -0.049 and weighted average of 4.7%, a difference of 33.7%.
Unemployment Correlation Summary
| Measurement | Jamaican | Bulgarian |
| Minimum | 3.2% | 0.30% |
| Maximum | 14.2% | 9.7% |
| Range | 11.0% | 9.4% |
| Mean | 6.9% | 4.6% |
| Median | 6.4% | 4.5% |
| Interquartile 25% (IQ1) | 5.9% | 3.6% |
| Interquartile 75% (IQ3) | 7.7% | 5.3% |
| Interquartile Range (IQR) | 1.8% | 1.7% |
| Standard Deviation (Sample) | 2.0% | 1.9% |
| Standard Deviation (Population) | 2.0% | 1.8% |
Similar Demographics by Unemployment
Demographics Similar to Jamaicans by Unemployment
In terms of unemployment, the demographic groups most similar to Jamaicans are Immigrants from Haiti (6.3%, a difference of 0.090%), Immigrants from West Indies (6.3%, a difference of 0.14%), Immigrants from Trinidad and Tobago (6.3%, a difference of 0.26%), Ute (6.3%, a difference of 0.34%), and Trinidadian and Tobagonian (6.3%, a difference of 0.74%).
| Demographics | Rating | Rank | Unemployment |
| Senegalese | 0.0 /100 | #290 | Tragic 6.2% |
| Haitians | 0.0 /100 | #291 | Tragic 6.2% |
| Central American Indians | 0.0 /100 | #292 | Tragic 6.2% |
| Immigrants | Ecuador | 0.0 /100 | #293 | Tragic 6.2% |
| Spanish American Indians | 0.0 /100 | #294 | Tragic 6.2% |
| U.S. Virgin Islanders | 0.0 /100 | #295 | Tragic 6.3% |
| Ute | 0.0 /100 | #296 | Tragic 6.3% |
| Jamaicans | 0.0 /100 | #297 | Tragic 6.3% |
| Immigrants | Haiti | 0.0 /100 | #298 | Tragic 6.3% |
| Immigrants | West Indies | 0.0 /100 | #299 | Tragic 6.3% |
| Immigrants | Trinidad and Tobago | 0.0 /100 | #300 | Tragic 6.3% |
| Trinidadians and Tobagonians | 0.0 /100 | #301 | Tragic 6.3% |
| West Indians | 0.0 /100 | #302 | Tragic 6.4% |
| Belizeans | 0.0 /100 | #303 | Tragic 6.4% |
| Immigrants | Jamaica | 0.0 /100 | #304 | Tragic 6.4% |
Demographics Similar to Bulgarians by Unemployment
In terms of unemployment, the demographic groups most similar to Bulgarians are Latvian (4.7%, a difference of 0.040%), Venezuelan (4.7%, a difference of 0.11%), British (4.7%, a difference of 0.19%), Finnish (4.7%, a difference of 0.21%), and Welsh (4.7%, a difference of 0.49%).
| Demographics | Rating | Rank | Unemployment |
| Scottish | 99.9 /100 | #19 | Exceptional 4.7% |
| Carpatho Rusyns | 99.9 /100 | #20 | Exceptional 4.7% |
| Welsh | 99.9 /100 | #21 | Exceptional 4.7% |
| Thais | 99.9 /100 | #22 | Exceptional 4.7% |
| British | 99.9 /100 | #23 | Exceptional 4.7% |
| Venezuelans | 99.9 /100 | #24 | Exceptional 4.7% |
| Latvians | 99.9 /100 | #25 | Exceptional 4.7% |
| Bulgarians | 99.9 /100 | #26 | Exceptional 4.7% |
| Finns | 99.9 /100 | #27 | Exceptional 4.7% |
| Cubans | 99.8 /100 | #28 | Exceptional 4.7% |
| Poles | 99.8 /100 | #29 | Exceptional 4.7% |
| Irish | 99.8 /100 | #30 | Exceptional 4.8% |
| Croatians | 99.8 /100 | #31 | Exceptional 4.8% |
| Zimbabweans | 99.8 /100 | #32 | Exceptional 4.8% |
| Sudanese | 99.8 /100 | #33 | Exceptional 4.8% |