Jamaican vs Bulgarian 2nd Grade
COMPARE
Jamaican
Bulgarian
2nd Grade
2nd Grade Comparison
Jamaicans
Bulgarians
97.5%
2ND GRADE
0.6/ 100
METRIC RATING
256th/ 347
METRIC RANK
98.3%
2ND GRADE
99.8/ 100
METRIC RATING
58th/ 347
METRIC RANK
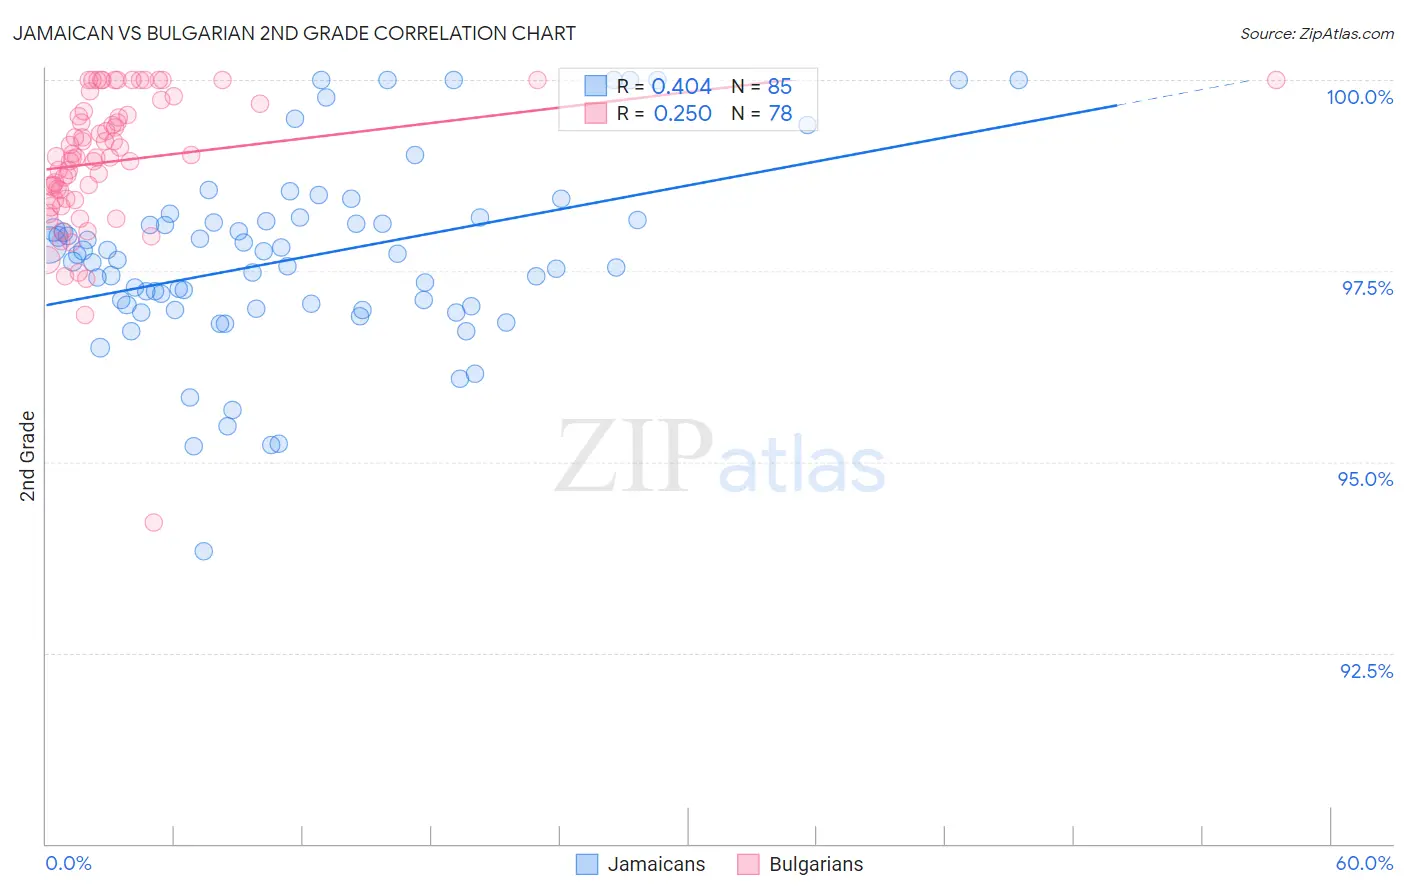
Jamaican vs Bulgarian 2nd Grade Correlation Chart
The statistical analysis conducted on geographies consisting of 368,084,732 people shows a moderate positive correlation between the proportion of Jamaicans and percentage of population with at least 2nd grade education in the United States with a correlation coefficient (R) of 0.404 and weighted average of 97.5%. Similarly, the statistical analysis conducted on geographies consisting of 205,633,223 people shows a weak positive correlation between the proportion of Bulgarians and percentage of population with at least 2nd grade education in the United States with a correlation coefficient (R) of 0.250 and weighted average of 98.3%, a difference of 0.89%.
2nd Grade Correlation Summary
| Measurement | Jamaican | Bulgarian |
| Minimum | 93.8% | 94.2% |
| Maximum | 100.0% | 100.0% |
| Range | 6.2% | 5.8% |
| Mean | 97.7% | 98.9% |
| Median | 97.7% | 99.0% |
| Interquartile 25% (IQ1) | 97.0% | 98.4% |
| Interquartile 75% (IQ3) | 98.2% | 99.6% |
| Interquartile Range (IQR) | 1.1% | 1.2% |
| Standard Deviation (Sample) | 1.2% | 0.93% |
| Standard Deviation (Population) | 1.2% | 0.93% |
Similar Demographics by 2nd Grade
Demographics Similar to Jamaicans by 2nd Grade
In terms of 2nd grade, the demographic groups most similar to Jamaicans are Indian (Asian) (97.5%, a difference of 0.0%), Immigrants from Congo (97.5%, a difference of 0.0%), Immigrants from Colombia (97.5%, a difference of 0.0%), Yaqui (97.5%, a difference of 0.010%), and Fijian (97.5%, a difference of 0.010%).
| Demographics | Rating | Rank | 2nd Grade |
| Bolivians | 0.9 /100 | #249 | Tragic 97.5% |
| Peruvians | 0.9 /100 | #250 | Tragic 97.5% |
| Immigrants | Africa | 0.8 /100 | #251 | Tragic 97.5% |
| Immigrants | Asia | 0.7 /100 | #252 | Tragic 97.5% |
| Puerto Ricans | 0.7 /100 | #253 | Tragic 97.5% |
| Indians (Asian) | 0.6 /100 | #254 | Tragic 97.5% |
| Immigrants | Congo | 0.6 /100 | #255 | Tragic 97.5% |
| Jamaicans | 0.6 /100 | #256 | Tragic 97.5% |
| Immigrants | Colombia | 0.5 /100 | #257 | Tragic 97.5% |
| Yaqui | 0.5 /100 | #258 | Tragic 97.5% |
| Fijians | 0.5 /100 | #259 | Tragic 97.5% |
| Assyrians/Chaldeans/Syriacs | 0.5 /100 | #260 | Tragic 97.5% |
| Armenians | 0.5 /100 | #261 | Tragic 97.5% |
| Taiwanese | 0.4 /100 | #262 | Tragic 97.4% |
| Immigrants | Ethiopia | 0.4 /100 | #263 | Tragic 97.4% |
Demographics Similar to Bulgarians by 2nd Grade
In terms of 2nd grade, the demographic groups most similar to Bulgarians are American (98.3%, a difference of 0.0%), Austrian (98.3%, a difference of 0.0%), Pueblo (98.3%, a difference of 0.010%), Kiowa (98.3%, a difference of 0.010%), and Immigrants from Scotland (98.3%, a difference of 0.010%).
| Demographics | Rating | Rank | 2nd Grade |
| Estonians | 99.8 /100 | #51 | Exceptional 98.4% |
| Australians | 99.8 /100 | #52 | Exceptional 98.4% |
| Pueblo | 99.8 /100 | #53 | Exceptional 98.3% |
| Kiowa | 99.8 /100 | #54 | Exceptional 98.3% |
| Immigrants | Scotland | 99.8 /100 | #55 | Exceptional 98.3% |
| Americans | 99.8 /100 | #56 | Exceptional 98.3% |
| Austrians | 99.8 /100 | #57 | Exceptional 98.3% |
| Bulgarians | 99.8 /100 | #58 | Exceptional 98.3% |
| Slavs | 99.8 /100 | #59 | Exceptional 98.3% |
| Creek | 99.8 /100 | #60 | Exceptional 98.3% |
| Immigrants | Canada | 99.8 /100 | #61 | Exceptional 98.3% |
| Greeks | 99.8 /100 | #62 | Exceptional 98.3% |
| Maltese | 99.7 /100 | #63 | Exceptional 98.3% |
| Immigrants | North America | 99.7 /100 | #64 | Exceptional 98.3% |
| New Zealanders | 99.7 /100 | #65 | Exceptional 98.3% |