Italian vs Immigrants from Lithuania 12th Grade, No Diploma
COMPARE
Italian
Immigrants from Lithuania
12th Grade, No Diploma
12th Grade, No Diploma Comparison
Italians
Immigrants from Lithuania
93.2%
12TH GRADE, NO DIPLOMA
99.9/ 100
METRIC RATING
21st/ 347
METRIC RANK
93.1%
12TH GRADE, NO DIPLOMA
99.9/ 100
METRIC RATING
30th/ 347
METRIC RANK
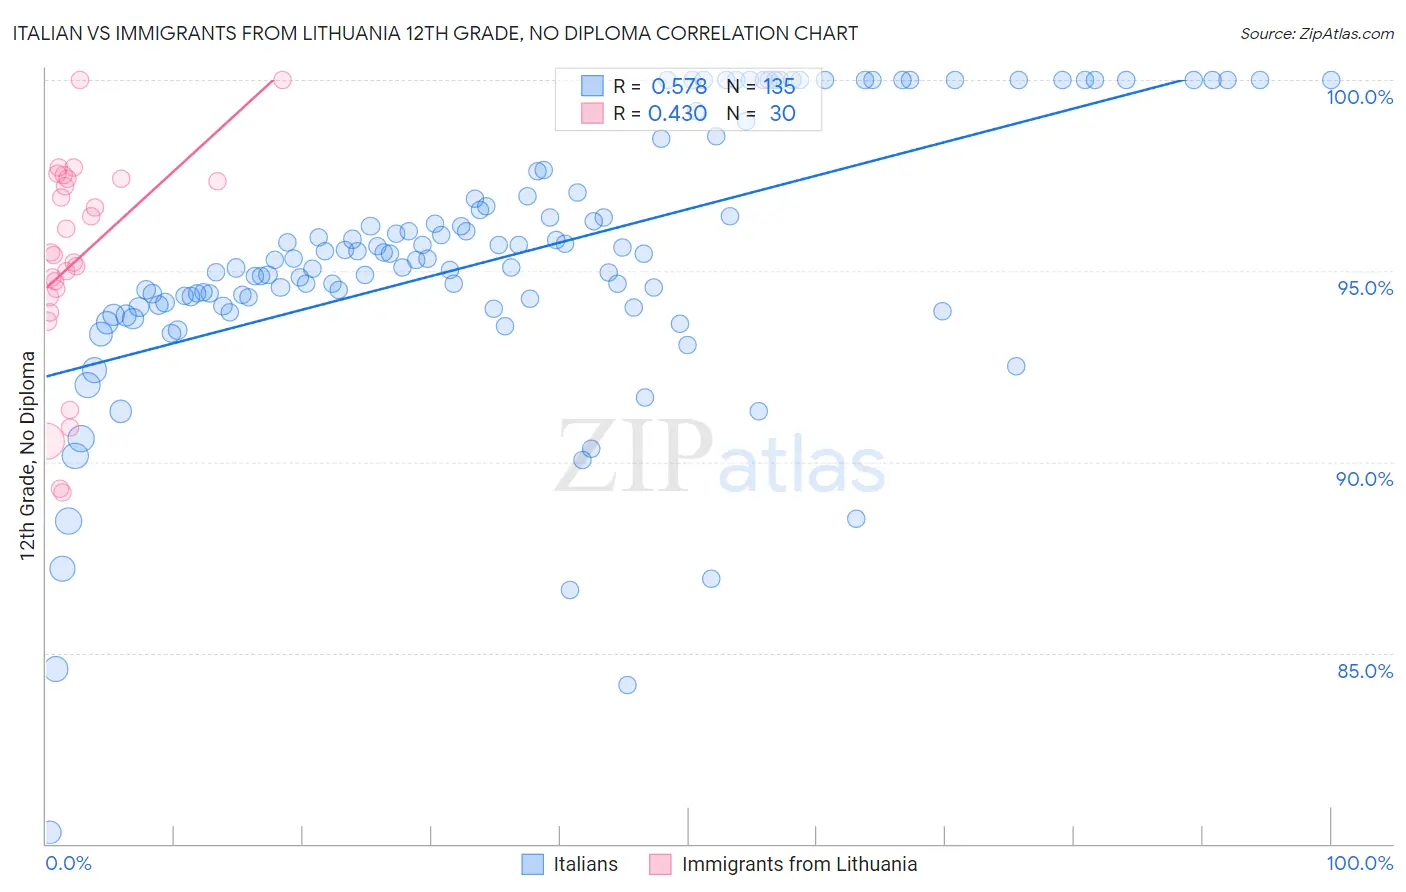
Italian vs Immigrants from Lithuania 12th Grade, No Diploma Correlation Chart
The statistical analysis conducted on geographies consisting of 575,116,620 people shows a substantial positive correlation between the proportion of Italians and percentage of population with at least 12th grade (no diploma) education in the United States with a correlation coefficient (R) of 0.578 and weighted average of 93.2%. Similarly, the statistical analysis conducted on geographies consisting of 117,724,932 people shows a moderate positive correlation between the proportion of Immigrants from Lithuania and percentage of population with at least 12th grade (no diploma) education in the United States with a correlation coefficient (R) of 0.430 and weighted average of 93.1%, a difference of 0.14%.
12th Grade, No Diploma Correlation Summary
| Measurement | Italian | Immigrants from Lithuania |
| Minimum | 80.3% | 89.2% |
| Maximum | 100.0% | 100.0% |
| Range | 19.7% | 10.8% |
| Mean | 95.4% | 95.3% |
| Median | 95.3% | 95.4% |
| Interquartile 25% (IQ1) | 94.1% | 94.3% |
| Interquartile 75% (IQ3) | 97.6% | 97.4% |
| Interquartile Range (IQR) | 3.5% | 3.1% |
| Standard Deviation (Sample) | 3.6% | 2.8% |
| Standard Deviation (Population) | 3.5% | 2.7% |
Demographics Similar to Italians and Immigrants from Lithuania by 12th Grade, No Diploma
In terms of 12th grade, no diploma, the demographic groups most similar to Italians are Estonian (93.2%, a difference of 0.010%), Filipino (93.2%, a difference of 0.020%), Scandinavian (93.2%, a difference of 0.020%), Thai (93.2%, a difference of 0.030%), and German (93.3%, a difference of 0.050%). Similarly, the demographic groups most similar to Immigrants from Lithuania are Iranian (93.1%, a difference of 0.0%), Immigrants from Northern Europe (93.1%, a difference of 0.010%), Immigrants from Ireland (93.1%, a difference of 0.020%), European (93.1%, a difference of 0.030%), and Cypriot (93.1%, a difference of 0.060%).
| Demographics | Rating | Rank | 12th Grade, No Diploma |
| Finns | 100.0 /100 | #15 | Exceptional 93.4% |
| Maltese | 100.0 /100 | #16 | Exceptional 93.3% |
| Luxembourgers | 100.0 /100 | #17 | Exceptional 93.3% |
| Immigrants | Singapore | 99.9 /100 | #18 | Exceptional 93.3% |
| Germans | 99.9 /100 | #19 | Exceptional 93.3% |
| Filipinos | 99.9 /100 | #20 | Exceptional 93.2% |
| Italians | 99.9 /100 | #21 | Exceptional 93.2% |
| Estonians | 99.9 /100 | #22 | Exceptional 93.2% |
| Scandinavians | 99.9 /100 | #23 | Exceptional 93.2% |
| Thais | 99.9 /100 | #24 | Exceptional 93.2% |
| Czechs | 99.9 /100 | #25 | Exceptional 93.2% |
| Russians | 99.9 /100 | #26 | Exceptional 93.2% |
| Cypriots | 99.9 /100 | #27 | Exceptional 93.1% |
| Immigrants | Northern Europe | 99.9 /100 | #28 | Exceptional 93.1% |
| Iranians | 99.9 /100 | #29 | Exceptional 93.1% |
| Immigrants | Lithuania | 99.9 /100 | #30 | Exceptional 93.1% |
| Immigrants | Ireland | 99.9 /100 | #31 | Exceptional 93.1% |
| Europeans | 99.9 /100 | #32 | Exceptional 93.1% |
| Immigrants | Scotland | 99.9 /100 | #33 | Exceptional 93.0% |
| Okinawans | 99.9 /100 | #34 | Exceptional 93.0% |
| English | 99.9 /100 | #35 | Exceptional 93.0% |