Israeli vs Marshallese Child Poverty Among Girls Under 16
COMPARE
Israeli
Marshallese
Child Poverty Among Girls Under 16
Child Poverty Among Girls Under 16 Comparison
Israelis
Marshallese
15.6%
CHILD POVERTY AMONG GIRLS UNDER 16
86.3/ 100
METRIC RATING
144th/ 347
METRIC RANK
18.7%
CHILD POVERTY AMONG GIRLS UNDER 16
0.9/ 100
METRIC RATING
239th/ 347
METRIC RANK
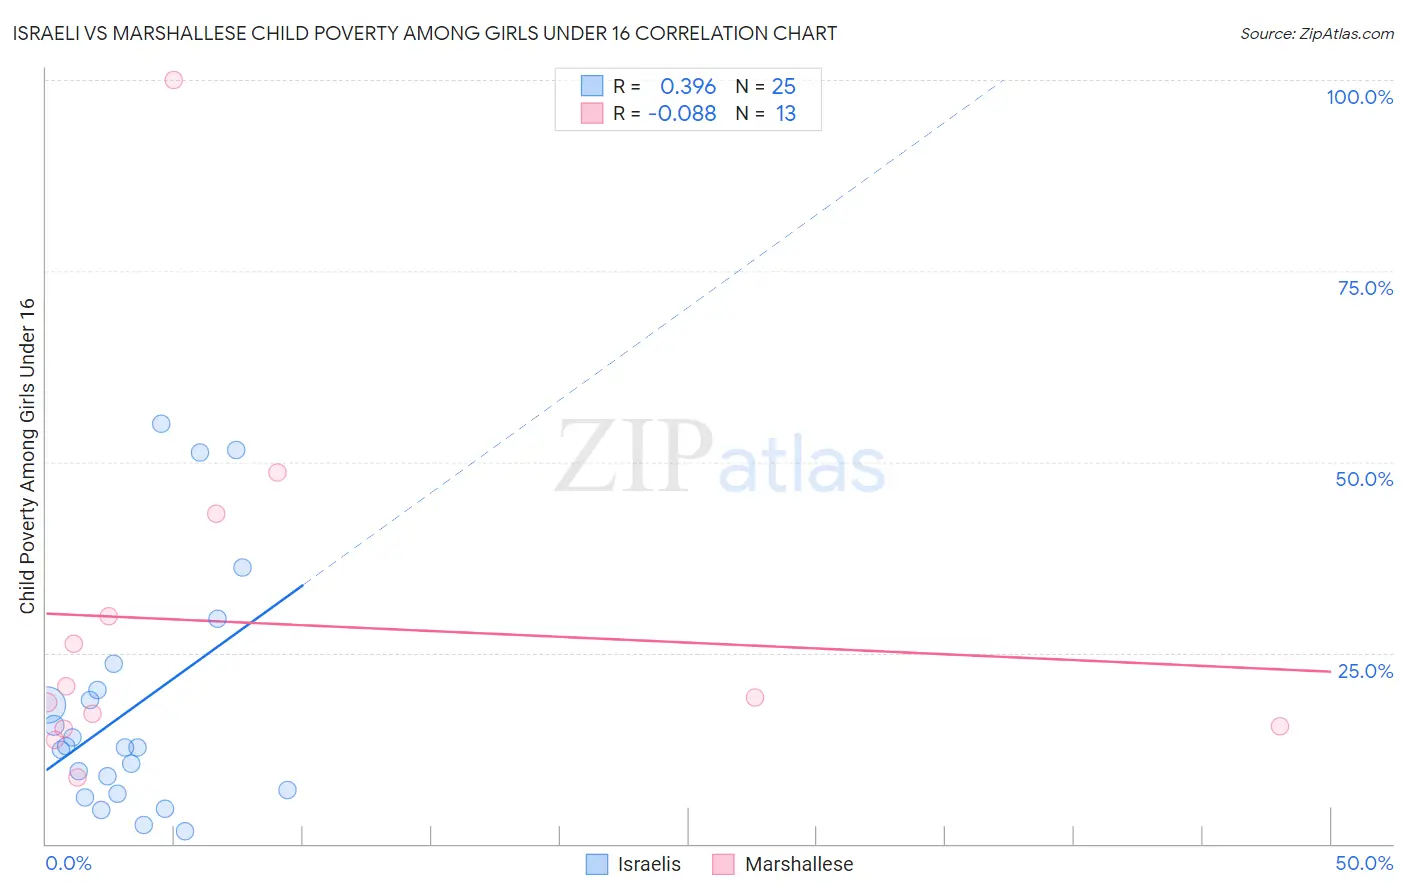
Israeli vs Marshallese Child Poverty Among Girls Under 16 Correlation Chart
The statistical analysis conducted on geographies consisting of 208,037,528 people shows a mild positive correlation between the proportion of Israelis and poverty level among girls under the age of 16 in the United States with a correlation coefficient (R) of 0.396 and weighted average of 15.6%. Similarly, the statistical analysis conducted on geographies consisting of 14,733,335 people shows a slight negative correlation between the proportion of Marshallese and poverty level among girls under the age of 16 in the United States with a correlation coefficient (R) of -0.088 and weighted average of 18.7%, a difference of 19.7%.
Child Poverty Among Girls Under 16 Correlation Summary
| Measurement | Israeli | Marshallese |
| Minimum | 1.6% | 8.7% |
| Maximum | 55.0% | 100.0% |
| Range | 53.4% | 91.3% |
| Mean | 17.8% | 28.9% |
| Median | 12.6% | 19.2% |
| Interquartile 25% (IQ1) | 6.7% | 15.2% |
| Interquartile 75% (IQ3) | 21.8% | 36.5% |
| Interquartile Range (IQR) | 15.1% | 21.3% |
| Standard Deviation (Sample) | 15.4% | 24.3% |
| Standard Deviation (Population) | 15.1% | 23.3% |
Similar Demographics by Child Poverty Among Girls Under 16
Demographics Similar to Israelis by Child Poverty Among Girls Under 16
In terms of child poverty among girls under 16, the demographic groups most similar to Israelis are Immigrants from Peru (15.6%, a difference of 0.090%), Welsh (15.6%, a difference of 0.20%), Canadian (15.6%, a difference of 0.24%), New Zealander (15.6%, a difference of 0.26%), and Immigrants from Jordan (15.6%, a difference of 0.26%).
| Demographics | Rating | Rank | Child Poverty Among Girls Under 16 |
| South Africans | 88.7 /100 | #137 | Excellent 15.5% |
| Immigrants | Vietnam | 88.2 /100 | #138 | Excellent 15.5% |
| Armenians | 87.9 /100 | #139 | Excellent 15.5% |
| New Zealanders | 87.2 /100 | #140 | Excellent 15.6% |
| Immigrants | Jordan | 87.2 /100 | #141 | Excellent 15.6% |
| Canadians | 87.1 /100 | #142 | Excellent 15.6% |
| Immigrants | Peru | 86.6 /100 | #143 | Excellent 15.6% |
| Israelis | 86.3 /100 | #144 | Excellent 15.6% |
| Welsh | 85.4 /100 | #145 | Excellent 15.6% |
| Samoans | 84.2 /100 | #146 | Excellent 15.7% |
| Slavs | 83.1 /100 | #147 | Excellent 15.7% |
| Icelanders | 82.4 /100 | #148 | Excellent 15.7% |
| Immigrants | Hungary | 80.9 /100 | #149 | Excellent 15.8% |
| Immigrants | Albania | 80.7 /100 | #150 | Excellent 15.8% |
| Venezuelans | 80.1 /100 | #151 | Excellent 15.8% |
Demographics Similar to Marshallese by Child Poverty Among Girls Under 16
In terms of child poverty among girls under 16, the demographic groups most similar to Marshallese are Immigrants from Eritrea (18.7%, a difference of 0.070%), Nigerian (18.7%, a difference of 0.14%), Immigrants from Nigeria (18.6%, a difference of 0.21%), Alsatian (18.6%, a difference of 0.33%), and Nepalese (18.6%, a difference of 0.35%).
| Demographics | Rating | Rank | Child Poverty Among Girls Under 16 |
| Immigrants | Sudan | 1.1 /100 | #232 | Tragic 18.6% |
| Sudanese | 1.1 /100 | #233 | Tragic 18.6% |
| Fijians | 1.1 /100 | #234 | Tragic 18.6% |
| Nepalese | 1.1 /100 | #235 | Tragic 18.6% |
| Alsatians | 1.1 /100 | #236 | Tragic 18.6% |
| Immigrants | Nigeria | 1.0 /100 | #237 | Tragic 18.6% |
| Immigrants | Eritrea | 1.0 /100 | #238 | Tragic 18.7% |
| Marshallese | 0.9 /100 | #239 | Tragic 18.7% |
| Nigerians | 0.9 /100 | #240 | Tragic 18.7% |
| Americans | 0.8 /100 | #241 | Tragic 18.8% |
| Immigrants | Cuba | 0.7 /100 | #242 | Tragic 18.8% |
| Immigrants | Nicaragua | 0.7 /100 | #243 | Tragic 18.8% |
| Ecuadorians | 0.7 /100 | #244 | Tragic 18.8% |
| Shoshone | 0.6 /100 | #245 | Tragic 18.9% |
| Immigrants | Laos | 0.6 /100 | #246 | Tragic 18.9% |